PINE LIBRARY
hinton_map
█ HINTON MAP
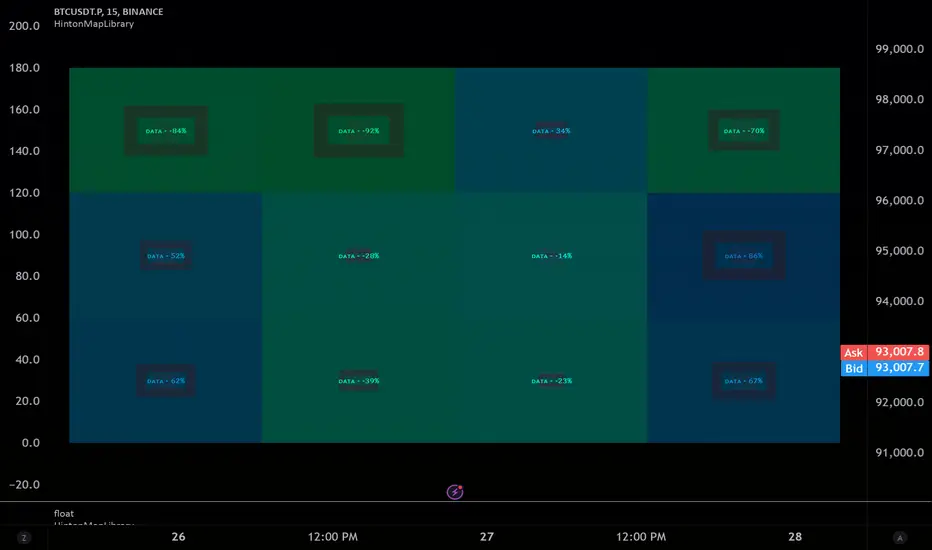
This library provides functions to create and display a Hinton Map visualization. A Hinton map uses squares to represent the magnitude and direction of values in a matrix. This library allows you to display multiple ticker/timeframe/indicator combinations on a single chart, using color/boxsize/bnordersize to represent the values used. The values must be from -1.0 to 1.0 in value. 3 different values can be input per square.
Example Usage:
The example below demonstrates how to create a Hinton Map for two symbols (AAPL and MSFT) across three timeframes (1 minute, 5 minutes, and 1 day).
Pine Script®
█ createHintonUnit
Creates a Hinton unit.
•fillValue
Value to determine the fill color hue.
Type: float
Default Value: 0.0
•borderValue
Value to determine the border color hue and width.
Type: float
Default Value: 0.0
•innerValue
Value to determine the inner box color hue.
Type: float
Default Value: 0.0
•boxText
Text to display in the inner box.
Type: dv.DisplayValue
Default Value: na
•tooltipText
Tooltip text for the inner box.
Type: dv.DisplayValue
Default Value: na
Returns: HintonUnit
█ initHintonData
Initializes Hinton map data structure.
•rows
Number of rows.
Type: int
•columns
Number of columns.
Type: int
Returns: HintonData
█ drawHintonMap
Draws a Hinton map.
•hintonData
Hinton map data.
Type: HintonData
•unitSize
Size of each unit in bars.
Type: int
Default Value: 10
•borderWidth
Base width of the inner box border.
Type: int
Default Value: 5
•plusHue
Hue value for positive values (0-360).
Type: float
Default Value: 180
•minusHue
Hue value for negative values (0-360).
Type: float
Default Value: -30
█ HintonUnit
Data for a Hinton unit.
•fillValue
Value to determine the fill color hue.
Type: float
•borderValue
Value to determine the border color hue and width.
Type: float
•innerValue
Value to determine the inner box color hue.
Type: float
•boxText
Text to display in the inner box.
Type: dv.DisplayValue
•tooltipText
Tooltip text for the inner box.
Type: dv.DisplayValue
█ HintonData
Structure to store Hinton map data.
•unitMatrix
Matrix of Hinton units.
Type: matrix<HintonUnit>
•lineMatrix
Matrix of lines.
Type: matrix<line>
•labelMatrix
Matrix of labels.
Type: matrix<label>
•boxMatrix
Matrix of boxes.
Type: matrix<box>
•fillMatrix
Matrix of line fills.
Type: matrix<linefill>
This library provides functions to create and display a Hinton Map visualization. A Hinton map uses squares to represent the magnitude and direction of values in a matrix. This library allows you to display multiple ticker/timeframe/indicator combinations on a single chart, using color/boxsize/bnordersize to represent the values used. The values must be from -1.0 to 1.0 in value. 3 different values can be input per square.
Example Usage:
The example below demonstrates how to create a Hinton Map for two symbols (AAPL and MSFT) across three timeframes (1 minute, 5 minutes, and 1 day).
var hintonData = hinton_map.initHintonData(2, 3)
tickers = array.from("AAPL", "MSFT")
timeframes = array.from("1", "5", "1D")
for i = 0 to array.size(tickers) - 1
for j = 0 to array.size(timeframes) - 1
ticker = array.get(tickers, i)
timeframe = array.get(timeframes, j)
[close_current, close_previous, rsi_current] = request.security(ticker, timeframe, [close, close[1], ta.rsi(close, 14)], lookahead = barmerge.lookahead_on)
percent_change = (close_current - close_previous) / close_previous * 100
rsi_deviation = rsi_current - 50
hintonData.unitMatrix.set(i, j, hinton_map.createHintonUnit(
fillValue = percent_change,
borderValue = rsi_deviation,
innerValue = percent_change * rsi_deviation,
boxText = dv.from_string(str.tostring(math.round(percent_change, 2)) + "%"),
tooltipText = dv.from_string(syminfo.ticker + ", " + timeframe + ": " + str.tostring(math.round(percent_change, 2)) + "%, RSI: " + str.tostring(math.round(rsi_current, 2)))
))
hinton_map.drawHintonMap(hintonData)
█ createHintonUnit
Creates a Hinton unit.
•fillValue
Value to determine the fill color hue.
Type: float
Default Value: 0.0
•borderValue
Value to determine the border color hue and width.
Type: float
Default Value: 0.0
•innerValue
Value to determine the inner box color hue.
Type: float
Default Value: 0.0
•boxText
Text to display in the inner box.
Type: dv.DisplayValue
Default Value: na
•tooltipText
Tooltip text for the inner box.
Type: dv.DisplayValue
Default Value: na
Returns: HintonUnit
█ initHintonData
Initializes Hinton map data structure.
•rows
Number of rows.
Type: int
•columns
Number of columns.
Type: int
Returns: HintonData
█ drawHintonMap
Draws a Hinton map.
•hintonData
Hinton map data.
Type: HintonData
•unitSize
Size of each unit in bars.
Type: int
Default Value: 10
•borderWidth
Base width of the inner box border.
Type: int
Default Value: 5
•plusHue
Hue value for positive values (0-360).
Type: float
Default Value: 180
•minusHue
Hue value for negative values (0-360).
Type: float
Default Value: -30
█ HintonUnit
Data for a Hinton unit.
•fillValue
Value to determine the fill color hue.
Type: float
•borderValue
Value to determine the border color hue and width.
Type: float
•innerValue
Value to determine the inner box color hue.
Type: float
•boxText
Text to display in the inner box.
Type: dv.DisplayValue
•tooltipText
Tooltip text for the inner box.
Type: dv.DisplayValue
█ HintonData
Structure to store Hinton map data.
•unitMatrix
Matrix of Hinton units.
Type: matrix<HintonUnit>
•lineMatrix
Matrix of lines.
Type: matrix<line>
•labelMatrix
Matrix of labels.
Type: matrix<label>
•boxMatrix
Matrix of boxes.
Type: matrix<box>
•fillMatrix
Matrix of line fills.
Type: matrix<linefill>
ספריית Pine
ברוח האמיתית של TradingView, המחבר לפרסם את הקוד של Pine הזה כספרייה בקוד פתוח, כך שמתכנתים אחרים בקהילתנו יעשו שימוש חוזר. כל הכבוד למחבר! ניתן להשתמש בספרייה הזו באופן פרטי או בומים בקוד פתוח, אך השימוש בחוזר בקוד הזה בפרסומים כפוף ל-כללי הבית.
כתב ויתור
המידע והפרסומים אינם מיועדים להיות, ואינם מהווים, ייעוץ או המלצה פיננסית, השקעתית, מסחרית או מכל סוג אחר המסופקת או מאושרת על ידי TradingView. קרא עוד ב־תנאי השימוש.