OPEN-SOURCE SCRIPT
Curved Smart Money Concepts Probability (Zeiierman)
█ Overview
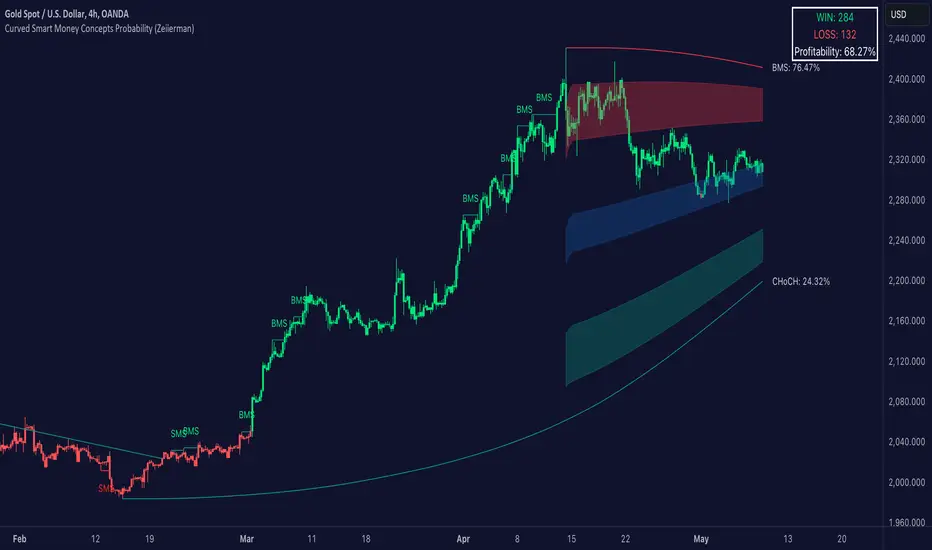
The Curved Smart Money Concepts Probability indicator, developed by Zeiierman, is a sophisticated trading tool designed to leverage the principles of Smart Money trading. This indicator identifies key market structure points and adapts to changing market conditions, providing traders with actionable insights into market trends and potential reversals. The trading tool stands out due to its unique curved structure and advanced probability features, which enhance its effectiveness and usability for traders.

█ How It Works
The indicator operates by analyzing market data to identify pivotal moments where institutional investors might be influencing price movements. It employs a combination of adaptive trend lengths, multipliers for sensitivity adjustments, and pivot periods to accurately capture market structure shifts. The indicator calculates upper and lower bands based on adaptive sizes and identifies zones of overbought (premium) and oversold (discount) conditions.
Key Features of Probability Calculations
The Curved Smart Money Concepts Probability indicator integrates sophisticated probability calculations to enhance trading decision-making:

Key benefits of the Curved Structure
The Curved Smart Money Concepts Probability indicator features a unique curved structure that offers several advantages over traditional linear structures:

█ Terminology
ChoCH (Change of Character): Indicates a potential reversal in market direction. It is identified when the price breaks a significant high or low, suggesting a shift from a bullish to bearish trend or vice versa.

SMS (Smart Money Shift): Represents the transition phase in market structure where smart money begins accumulating or distributing assets. It typically follows a BMS and indicates the start of a new trend.

BMS (Bullish/Bearish Market Structure): Confirms the trend direction. Bullish Market Structure (BMS) confirms an uptrend, while Bearish Market Structure (BMS) confirms a downtrend. It is characterized by a series of higher highs and higher lows (bullish) or lower highs and lower lows (bearish).

Premium: A zone where the price is considered overbought. It is calculated as the upper range of the current market structure and indicates a potential area for selling or shorting.
Mid Range: The midpoint between the high and low of the market structure. It often acts as a support or resistance level, helping traders identify potential reversal or continuation points.
Discount: A zone where the price is considered oversold. It is calculated as the lower range of the current market structure and indicates a potential area for buying or going long.

█ How to Use
Identifying Trends and Reversals: Traders can use the indicator to identify the overall market trend and potential reversal points. By observing the ChoCH, SMS, and BMS signals, traders can gauge whether the market is transitioning into a new trend or continuing the current trend.

Example Strategies
⚪ Trend Following Strategy:

⚪ Reversal Strategy:

█ Settings
-----------------
Disclaimer
The information contained in my Scripts/Indicators/Ideas/Algos/Systems does not constitute financial advice or a solicitation to buy or sell any securities of any type. I will not accept liability for any loss or damage, including without limitation any loss of profit, which may arise directly or indirectly from the use of or reliance on such information.
All investments involve risk, and the past performance of a security, industry, sector, market, financial product, trading strategy, backtest, or individual's trading does not guarantee future results or returns. Investors are fully responsible for any investment decisions they make. Such decisions should be based solely on an evaluation of their financial circumstances, investment objectives, risk tolerance, and liquidity needs.
My Scripts/Indicators/Ideas/Algos/Systems are only for educational purposes!
The Curved Smart Money Concepts Probability indicator, developed by Zeiierman, is a sophisticated trading tool designed to leverage the principles of Smart Money trading. This indicator identifies key market structure points and adapts to changing market conditions, providing traders with actionable insights into market trends and potential reversals. The trading tool stands out due to its unique curved structure and advanced probability features, which enhance its effectiveness and usability for traders.
█ How It Works
The indicator operates by analyzing market data to identify pivotal moments where institutional investors might be influencing price movements. It employs a combination of adaptive trend lengths, multipliers for sensitivity adjustments, and pivot periods to accurately capture market structure shifts. The indicator calculates upper and lower bands based on adaptive sizes and identifies zones of overbought (premium) and oversold (discount) conditions.
Key Features of Probability Calculations
The Curved Smart Money Concepts Probability indicator integrates sophisticated probability calculations to enhance trading decision-making:
- Win/Loss Tracking: The indicator tracks the number of successful (win) and unsuccessful (loss) trades based on the identified market structure points (ChoCH, SMS, BMS). This provides a historical context of the indicator's performance.
- Probability Percentages: For each market structure point (ChoCH, SMS, BMS), the indicator calculates the probability of the next move being successful or not. This is presented as a percentage, giving traders a quantifiable measure of confidence in the signals.
- Dynamic Adaptation: The probability calculations adapt to market conditions by considering the frequency and success rate of the signals, allowing traders to adjust their strategies based on the indicator’s historical accuracy.
- Visual Representation: Probabilities are displayed on the chart, helping traders quickly assess the likelihood of future price movements based on past performance.
Key benefits of the Curved Structure
The Curved Smart Money Concepts Probability indicator features a unique curved structure that offers several advantages over traditional linear structures:
- Noise Reduction: The curved structure smooths out short-term market fluctuations, reducing the noise often seen in linear structures. This helps traders focus on the true trend direction rather than getting distracted by minor price movements.
- Adaptive Sensitivity: The curved structure adjusts its sensitivity based on market conditions. This means it can effectively capture both short-term and long-term trends by dynamically adapting to changes in market volatility, something linear structures struggle with.
- Enhanced Trend Detection: By providing a more gradual transition between market phases, the curved structure helps in identifying trends more accurately. This is particularly useful in volatile markets where linear structures might give false signals due to their rigid nature.
- Improved Market Structure Analysis: The curved structure's ability to adapt and smooth out irregularities provides a clearer picture of the overall market structure. This clarity is essential for identifying premium and discount zones, as well as mid-range support and resistance levels, which are crucial for effective ICT Smart Money Trading.
█ Terminology
ChoCH (Change of Character): Indicates a potential reversal in market direction. It is identified when the price breaks a significant high or low, suggesting a shift from a bullish to bearish trend or vice versa.
SMS (Smart Money Shift): Represents the transition phase in market structure where smart money begins accumulating or distributing assets. It typically follows a BMS and indicates the start of a new trend.
BMS (Bullish/Bearish Market Structure): Confirms the trend direction. Bullish Market Structure (BMS) confirms an uptrend, while Bearish Market Structure (BMS) confirms a downtrend. It is characterized by a series of higher highs and higher lows (bullish) or lower highs and lower lows (bearish).
Premium: A zone where the price is considered overbought. It is calculated as the upper range of the current market structure and indicates a potential area for selling or shorting.
Mid Range: The midpoint between the high and low of the market structure. It often acts as a support or resistance level, helping traders identify potential reversal or continuation points.
Discount: A zone where the price is considered oversold. It is calculated as the lower range of the current market structure and indicates a potential area for buying or going long.
█ How to Use
Identifying Trends and Reversals: Traders can use the indicator to identify the overall market trend and potential reversal points. By observing the ChoCH, SMS, and BMS signals, traders can gauge whether the market is transitioning into a new trend or continuing the current trend.
Example Strategies
⚪ Trend Following Strategy:
- Identify the current market trend using BMS signals.
- Enter a trade in the direction of the trend when the price retraces to the mid-range zone.
- Set a stop-loss just below the mid-range (for long trades) or above the mid-range (for short trades).
- Take profit in the premium/discount zone or when a ChoCH signal indicates a potential reversal.
⚪ Reversal Strategy:
- Wait for a ChoCH signal to identify a potential market reversal.
- Enter a trade in the direction of the new trend as indicated by the SMS signal.
- Set a stop-loss just beyond the recent high (for short trades) or low (for long trades).
- Take profit when the price reaches the premium or discount zone opposite to the entry.
█ Settings
- Curved Trend Length: Determines the length of the trend used to calculate the adaptive size of the structure. Adjusting this length allows traders to capture either longer-term trends (for smoother curves) or short-term trends (for more reactive curves).
- Curved Multiplier: Scales the adjustment factors for the upper and lower bands. Increasing the multiplier widens the bands, reducing sensitivity to price changes. Decreasing it narrows the bands, making the structure more responsive.
- Pivot Period: Sets the period for capturing trends. A higher period captures broader trends, while a lower period focuses on short-term trends.
- Response Period: Adjusts the structure’s responsiveness. A low value focuses on short-term changes, while a high value smoothens the structure.
- Premium/Discount Range: Allows toggling between displaying the active range or previous range to analyze real-time or historical levels.
- Structure Candles: Enables the display of curved structure candles on the chart, providing a modified view of price action.
-----------------
Disclaimer
The information contained in my Scripts/Indicators/Ideas/Algos/Systems does not constitute financial advice or a solicitation to buy or sell any securities of any type. I will not accept liability for any loss or damage, including without limitation any loss of profit, which may arise directly or indirectly from the use of or reliance on such information.
All investments involve risk, and the past performance of a security, industry, sector, market, financial product, trading strategy, backtest, or individual's trading does not guarantee future results or returns. Investors are fully responsible for any investment decisions they make. Such decisions should be based solely on an evaluation of their financial circumstances, investment objectives, risk tolerance, and liquidity needs.
My Scripts/Indicators/Ideas/Algos/Systems are only for educational purposes!
סקריפט קוד פתוח
ברוח האמיתית של TradingView, יוצר הסקריפט הזה הפך אותו לקוד פתוח, כך שסוחרים יוכלו לעיין בו ולאמת את פעולתו. כל הכבוד למחבר! אמנם ניתן להשתמש בו בחינם, אך זכור כי פרסום חוזר של הקוד כפוף ל־כללי הבית שלנו.
Access my indicators at: zeiierman.com
Join Our Free Discord: discord.gg/zeiiermantrading
Join Our Free Discord: discord.gg/zeiiermantrading
כתב ויתור
המידע והפרסומים אינם מיועדים להיות, ואינם מהווים, ייעוץ או המלצה פיננסית, השקעתית, מסחרית או מכל סוג אחר המסופקת או מאושרת על ידי TradingView. קרא עוד ב־תנאי השימוש.