OPEN-SOURCE SCRIPT
מעודכן multi-tf standard devs [keypoems]
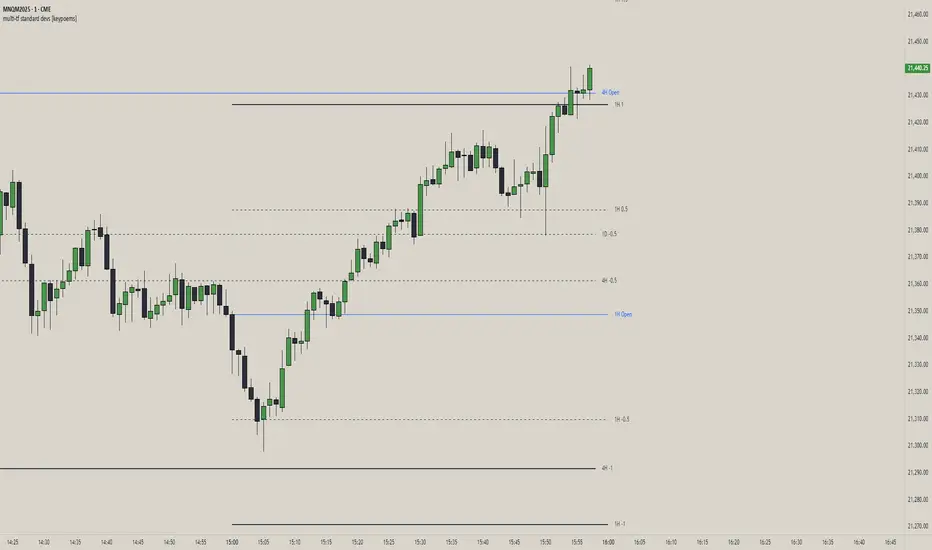
Multi-Timeframe Standard Deviations Levels
A visual map of “how far is too far” across any three higher time-frames.
1. What it does
This script plots dynamic price “rails” built from standard deviation (StDev)—the same math that underpins the bell curve—on up to three higher-time-frames (HTFs) at once.
• It measures the volatility of intraday open-to-close increments, reaching back as far as 5000 bars (≈ 20 years on daily data).
• Each HTF can be extended to the next session or truncated at session close for tidy dashboards.
• Lines can be mirrored so you see symmetric positive/negative bands, and optional background fills shade the “probability cone.”
Because ≈ 68 % of moves live inside ±1 StDev, ≈ 95 % inside ±2, and ≈ 99.7 % inside ±3, the plot instantly shows when price is statistically stretched or compressed.
3. Key settings
Higher Time-Frame #1-3 Turn each HTF on/off, pick the interval (anything from 1 min to 1 year), and decide whether lines should extend into the next period.
Show levels for last X days Keep your chart clean by limiting how many historical sessions are displayed (1-50).
Based on last X periods Length of the StDev sample. Long look-backs (e.g. 5 000) iron-out day-to-day noise; short look-backs make the bands flex with recent volatility.
Fib Settings Toggle each multiple, line thickness/style/colour, label size, whether to print the numeric level, the live price, the HTF label, and whether to tint the background (choose your own opacity).
4. Under-the-hood notes
StDev is calculated on (close – open) / open rather than absolute prices, making the band width scale-agnostic.
Watch for tests of ±1:
Momentum traders ride the breakout with a target at the next band.
Mean-reversion traders wait for the first stall candle and trade back to zero line or VWAP.
Bottom line: Multi-Timeframe Standard-Deviations turns raw volatility math into an intuitive “price terrain map,” helping you instantly judge whether a move is ordinary, stretched, or extreme—across the time-frames that matter to you.
Original code by fadizeidan and stats by NQStats's ProbableChris.
הערות שחרור
Changelog (internal version v16): - Bugfix: pruning of older periods fib levels now works according to settings.
הערות שחרור
Changelog: (internal version v30)- Fix memory leaks and refactor code to reduce memory footprint.
סקריפט קוד פתוח
ברוח האמיתית של TradingView, יוצר הסקריפט הזה הפך אותו לקוד פתוח, כך שסוחרים יוכלו לעיין בו ולאמת את פעולתו. כל הכבוד למחבר! אמנם ניתן להשתמש בו בחינם, אך זכור כי פרסום חוזר של הקוד כפוף ל־כללי הבית שלנו.
כתב ויתור
המידע והפרסומים אינם מיועדים להיות, ואינם מהווים, ייעוץ או המלצה פיננסית, השקעתית, מסחרית או מכל סוג אחר המסופקת או מאושרת על ידי TradingView. קרא עוד ב־תנאי השימוש.