OPEN-SOURCE SCRIPT
Opposite Delta Candle Highlighter with EMAs & Delta Boxes
**Description:**
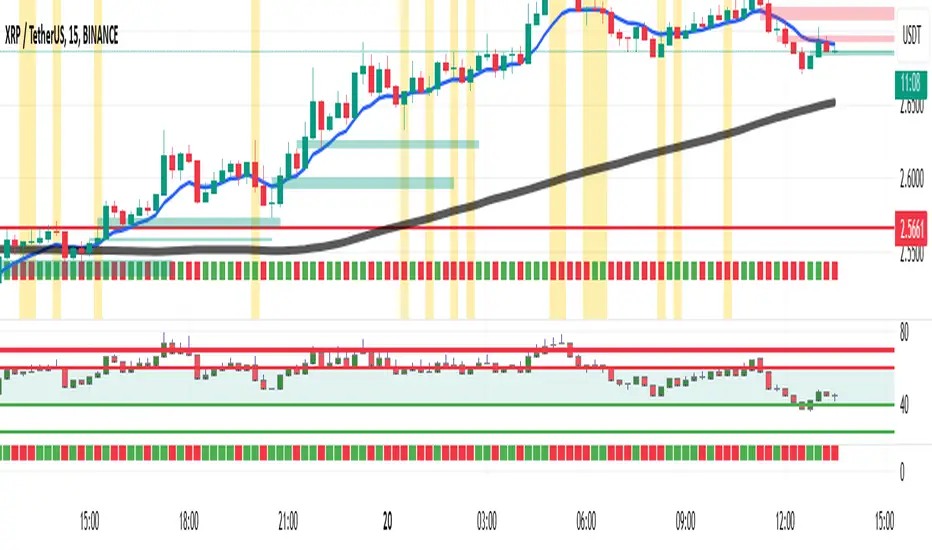
This indicator is designed to enhance market analysis by highlighting **candles with opposite-colored delta**, plotting **Exponential Moving Averages (EMAs)**, and displaying **delta volume as small boxes below the chart**.
🔹 **Key Features:**
✅ **Opposite Delta Candle Highlighting** – Candles where delta volume contradicts the price direction are highlighted with a **yellow background** and a **blue triangle** above the bar.
✅ **Three Exponential Moving Averages (EMAs)** – Includes **EMA (9, 21, 50)** to help identify trends and dynamic support/resistance levels.
✅ **Delta Volume Display** – Instead of large volume columns, delta is plotted as **small square boxes below the chart**, ensuring clear visibility without overlapping price candles.
✅ **Optimized for Lower Timeframes** – The indicator **automatically selects an appropriate lower timeframe** for more precise delta calculations.
🔹 **How It Works:**
- **Green Candle + Red Delta** → Opposite delta signal (Bearish Sign).
- **Red Candle + Green Delta** → Opposite delta signal (Bullish Sign).
- **Delta bars below the chart** indicate the strength of buying/selling pressure.
- **EMAs help identify the market trend** and potential trade entry zones.
🔹 **Use Cases:**
✔ **Scalping & Day Trading** – Identify potential reversals and trend continuation setups.
✔ **Volume Analysis** – Understand market participation and possible absorption.
✔ **Trend Confirmation** – Use EMAs to confirm trend direction alongside delta volume.
📌 *Best used with lower timeframes (1m, 5m, 15m) for detailed volume analysis.*
🚀 **Enhance your trading with real-time delta insights and price action analysis!**
סקריפט קוד פתוח
ברוח האמיתית של TradingView, יוצר הסקריפט הזה הפך אותו לקוד פתוח, כך שסוחרים יוכלו לעיין בו ולאמת את פעולתו. כל הכבוד למחבר! אמנם ניתן להשתמש בו בחינם, אך זכור כי פרסום חוזר של הקוד כפוף ל־כללי הבית שלנו.
כתב ויתור
המידע והפרסומים אינם מיועדים להיות, ואינם מהווים, ייעוץ או המלצה פיננסית, השקעתית, מסחרית או מכל סוג אחר המסופקת או מאושרת על ידי TradingView. קרא עוד ב־תנאי השימוש.