OPEN-SOURCE SCRIPT
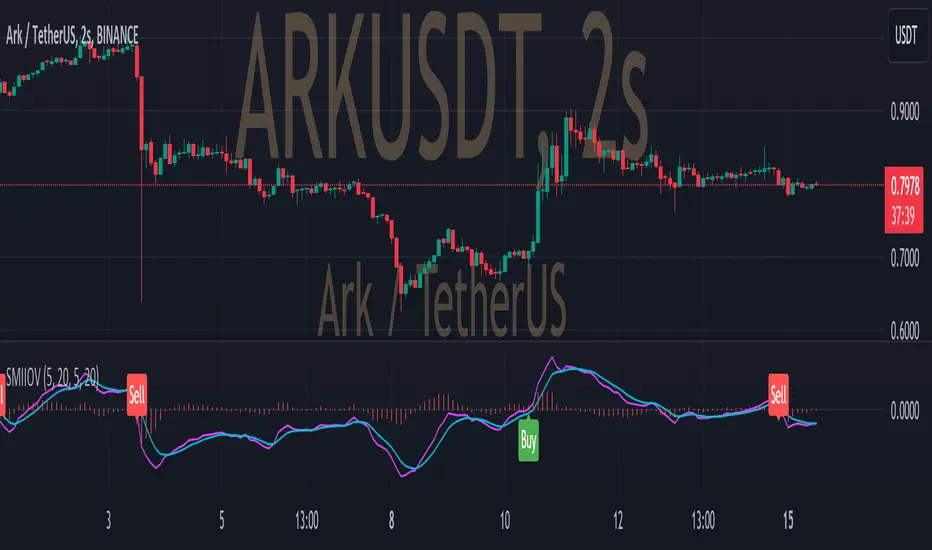
SMIIO + Volume

This indicator generates long and short signals.
The operation of the indicator is as follows;
First, true strength index is calculated with closing prices. We call this the "ergodic" curve.
Then the average of the ergodic (ema) is calculated to obtain the "signal" curve.
To calculate the "oscillator", the signal is subtracted from ergodic (oscillator = ergodic - signal).
The last variable to be used in the calculation is the average volume, calculated with sma.
Calculation for long signal;
- If the ergodic curve cross up the zero line (ergodic > 0 AND ergodic[1] < 0) and,
- If the current oscillator is greater than the previous oscillator (oscillator > oscillator[1]) and,
- If the current ergonic is greater than the previous signal (ergonic > signal) and,
- If the current volume is greater than the average volume (volume > averageVolume) and,
- If the current candle closing price is greater than the opening price (close > open)
If all the above conditions are fullfilled, the long input signal is issued with "Buy" label.
Calculation for short signal;
- If the ergodic curve cross down the zero line (ergodic < 0 AND ergodic[1] > 0) and,
- If the current oscillator is smaller than the previous oscillator (oscillator < oscillator[1]) and,
- If the current ergonic is smaller than the previous signal (ergonic < signal) and,
- If the current volume is greater than the average volume (volume > averageVolume) and,
- If the current candle closing price is smaller than the opening price (close < open)
If all the above conditions are fullfilled, the short input signal is issued with "Sell" label.
סקריפט קוד פתוח
ברוח האמיתית של TradingView, יוצר הסקריפט הזה הפך אותו לקוד פתוח, כך שסוחרים יוכלו לעיין בו ולאמת את פעולתו. כל הכבוד למחבר! אמנם ניתן להשתמש בו בחינם, אך זכור כי פרסום חוזר של הקוד כפוף ל־כללי הבית שלנו.
כתב ויתור
המידע והפרסומים אינם מיועדים להיות, ואינם מהווים, ייעוץ או המלצה פיננסית, השקעתית, מסחרית או מכל סוג אחר המסופקת או מאושרת על ידי TradingView. קרא עוד ב־תנאי השימוש.