PROTECTED SOURCE SCRIPT
מעודכן True Range(TR) + Average True Range (ATR) COMBINED
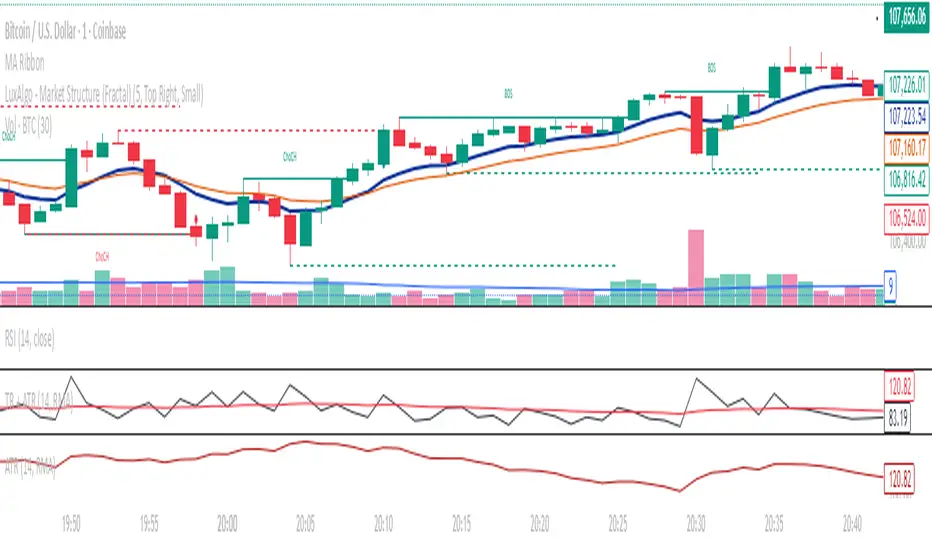
This indicator combines True Range (TR) and Average True Range (ATR) into a single panel for a clearer understanding of price volatility.
True Range (TR) measures the absolute price movement between highs, lows, and previous closes — showing raw, unsmoothed volatility.
Average True Range (ATR) is a moving average of the True Range, providing a smoother, more stable volatility signal.
📊 Usage Tips:
High TR/ATR values indicate strong price movement or volatility expansion.
Low values suggest compression or a potential volatility breakout zone.
Can be used for stop-loss placement, volatility filters, or trend strength confirmation.
⚙️ Features:
Multiple smoothing methods: RMA, SMA, EMA, WMA.
Adjustable ATR length.
Separate colored plots for TR (yellow) and ATR (red).
Works across all timeframes and instruments.
הערות שחרור
This indicator combines True Range (TR) and Average True Range (ATR) into a single panel for a clearer understanding of price volatility.True Range (TR) measures the absolute price movement between highs, lows, and previous closes — showing raw, unsmoothed volatility.
Average True Range (ATR) is a moving average of the True Range, providing a smoother, more stable volatility signal.
📊 Usage Tips:
High TR/ATR values indicate strong price movement or volatility expansion.
Low values suggest compression or a potential volatility breakout zone.
Can be used for stop-loss placement, volatility filters, or trend strength confirmation.
⚙️ Features:
Multiple smoothing methods: RMA, SMA, EMA, WMA.
Adjustable ATR length.
Separate colored plots for TR (yellow) and ATR (red).
Works across all timeframes and instruments.
סקריפט מוגן
סקריפט זה פורסם כמקור סגור. עם זאת, תוכל להשתמש בו בחופשיות וללא כל מגבלות – למד עוד כאן
כתב ויתור
המידע והפרסומים אינם מיועדים להיות, ואינם מהווים, ייעוץ או המלצה פיננסית, השקעתית, מסחרית או מכל סוג אחר המסופקת או מאושרת על ידי TradingView. קרא עוד ב־תנאי השימוש.
סקריפט מוגן
סקריפט זה פורסם כמקור סגור. עם זאת, תוכל להשתמש בו בחופשיות וללא כל מגבלות – למד עוד כאן
כתב ויתור
המידע והפרסומים אינם מיועדים להיות, ואינם מהווים, ייעוץ או המלצה פיננסית, השקעתית, מסחרית או מכל סוג אחר המסופקת או מאושרת על ידי TradingView. קרא עוד ב־תנאי השימוש.