OPEN-SOURCE SCRIPT
Live off your portofolio (decumulate)
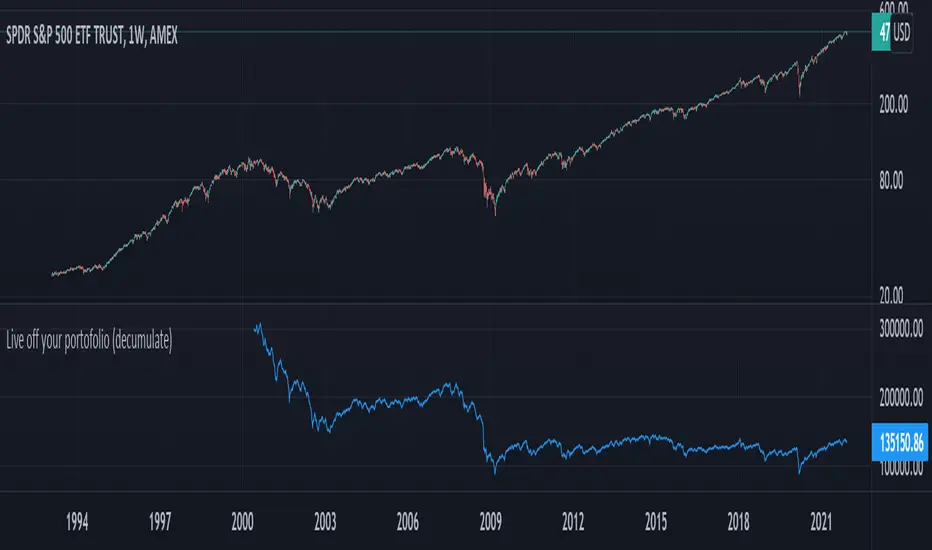
This indicator simulates living off your portofolio consisting of a single security or stock such as the SPY etf or even Bitcoin. The simulation starts at a certain point on the chart (which you input as year and month).
Withrawals from the portofolio are made each month according to the yearly withdrawal rate you enter, such as the 4% SWR. The monthly withdrawal income is calculated in USD at the beginning of the retirement period and then adjusted according to the US inflation (CPI) on 01/01 of each year.
The blue graph represents the USD value of the remaining portofolio.
This indicator is meant to be used on daily, weekly or monthly time frame. It may not work properly (and makes little sense to use) on intraday timeframe or larger time frames such as quarterly (3M).
When withdrawing, the indicator considers that fractional stock values can be used (the portofolio value is kept as a float). This may not be true, as most stock brokers currently don't allow this.
It does not explicitly take into account dividends. In order to do this you will have to enable "Adjust for dividends" by clicking on "adj" in the lower right corner of the screen, or by using the indicator on a Total Return (TR) index such as DAX. Unfortunately SPX does not have dividend data, you will have to use the SPY etf (which doesn't have a long history)
סקריפט קוד פתוח
ברוח האמיתית של TradingView, יוצר הסקריפט הזה הפך אותו לקוד פתוח, כך שסוחרים יוכלו לעיין בו ולאמת את פעולתו. כל הכבוד למחבר! אמנם ניתן להשתמש בו בחינם, אך זכור כי פרסום חוזר של הקוד כפוף ל־כללי הבית שלנו.
כתב ויתור
המידע והפרסומים אינם מיועדים להיות, ואינם מהווים, ייעוץ או המלצה פיננסית, השקעתית, מסחרית או מכל סוג אחר המסופקת או מאושרת על ידי TradingView. קרא עוד ב־תנאי השימוש.