OPEN-SOURCE SCRIPT
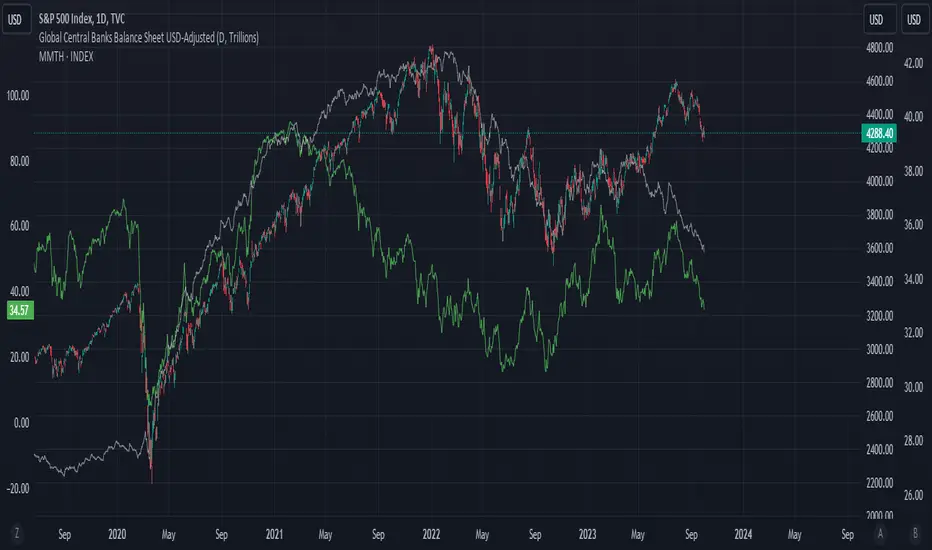
מעודכן Global Central Banks Balance Sheet USD-Adjusted

Summing up central banks balance sheet of:
US , China, EU, Japan, UK,
Swiss, Australia, Canada, Norway
Brazil, Russia, India, Mexico, Indonesia
Taiwan, HK, Korea, SG, Thailand
Then adjusting it to USD as the common denominator for comparison.
Net Foreign Assets (or foreign reserves) + Net Domestic Assets (or domestic credit, usually Money Supply M1) = Total Assets of the Central Bank Balance Sheet
In some way, the central bank balance sheet could be M2. However, I find some of the indicators don't add up and I don't have the time to check them out. This indicator is just a proxy. The issue with using central bank balance sheet to determine liquidity in the system is that it doesn't account for 1) collateral used for liquidity management in the public and private system, 2) shadow-banking financial system. As usual, US + EU + Japan publishes their data every weekly and the rest of the central banks publish monthly. I have removed any country with hard-pegged currencies except HK.
Additional materials to aid understanding:
imf.org/-/media/Files/News/Seminars/2017/macroeconomist-training-program-011118/session-2-1.ashx
הערות שחרור
oreilly.com/library/view/central-bank-balance/9781547400591/content/13_chapter03.xhtmlyardeni.com/pub/balsheetwk.pdf
ECB, Fed and BOJ updates weekly. The rest is monthly or annually.
הערות שחרור
Changed the intro chart back to SPX vs market breadth vs this indicatorהערות שחרור
-סקריפט קוד פתוח
ברוח TradingView אמיתית, היוצר של הסקריפט הזה הפך אותו לקוד פתוח, כך שסוחרים יכולים לבדוק ולאמת את הפונקציונליות שלו. כל הכבוד למחבר! למרות שאתה יכול להשתמש בו בחינם, זכור שפרסום מחדש של הקוד כפוף לכללי הבית שלנו.
כתב ויתור
המידע והפרסומים אינם אמורים להיות, ואינם מהווים, עצות פיננסיות, השקעות, מסחר או סוגים אחרים של עצות או המלצות שסופקו או מאושרים על ידי TradingView. קרא עוד בתנאים וההגבלות.
סקריפט קוד פתוח
ברוח TradingView אמיתית, היוצר של הסקריפט הזה הפך אותו לקוד פתוח, כך שסוחרים יכולים לבדוק ולאמת את הפונקציונליות שלו. כל הכבוד למחבר! למרות שאתה יכול להשתמש בו בחינם, זכור שפרסום מחדש של הקוד כפוף לכללי הבית שלנו.
כתב ויתור
המידע והפרסומים אינם אמורים להיות, ואינם מהווים, עצות פיננסיות, השקעות, מסחר או סוגים אחרים של עצות או המלצות שסופקו או מאושרים על ידי TradingView. קרא עוד בתנאים וההגבלות.