OPEN-SOURCE SCRIPT
20 Week SMA Risk Rating
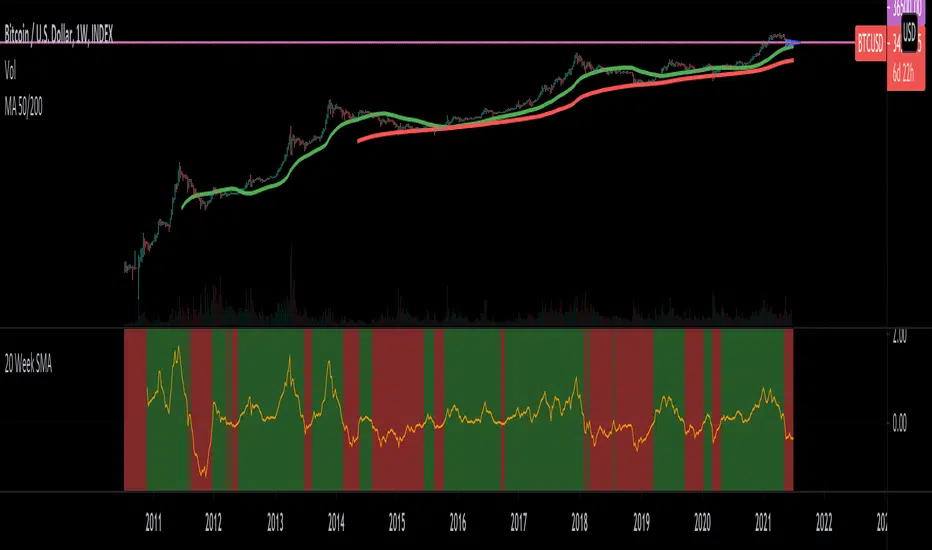
Use this indicator in the Weekly graph.
Green background indicates we are above the 20-day SMA; red background indicates we are under the 20-day SMA.
The lower we are the 20-day SMA indicates the bottom is near. The higher we are the 20-day SMA indicates there's the possibility to start climbing down.
Green background indicates we are above the 20-day SMA; red background indicates we are under the 20-day SMA.
The lower we are the 20-day SMA indicates the bottom is near. The higher we are the 20-day SMA indicates there's the possibility to start climbing down.
סקריפט קוד פתוח
ברוח האמיתית של TradingView, יוצר הסקריפט הזה הפך אותו לקוד פתוח, כך שסוחרים יוכלו לעיין בו ולאמת את פעולתו. כל הכבוד למחבר! אמנם ניתן להשתמש בו בחינם, אך זכור כי פרסום חוזר של הקוד כפוף ל־כללי הבית שלנו.
כתב ויתור
המידע והפרסומים אינם מיועדים להיות, ואינם מהווים, ייעוץ או המלצה פיננסית, השקעתית, מסחרית או מכל סוג אחר המסופקת או מאושרת על ידי TradingView. קרא עוד ב־תנאי השימוש.