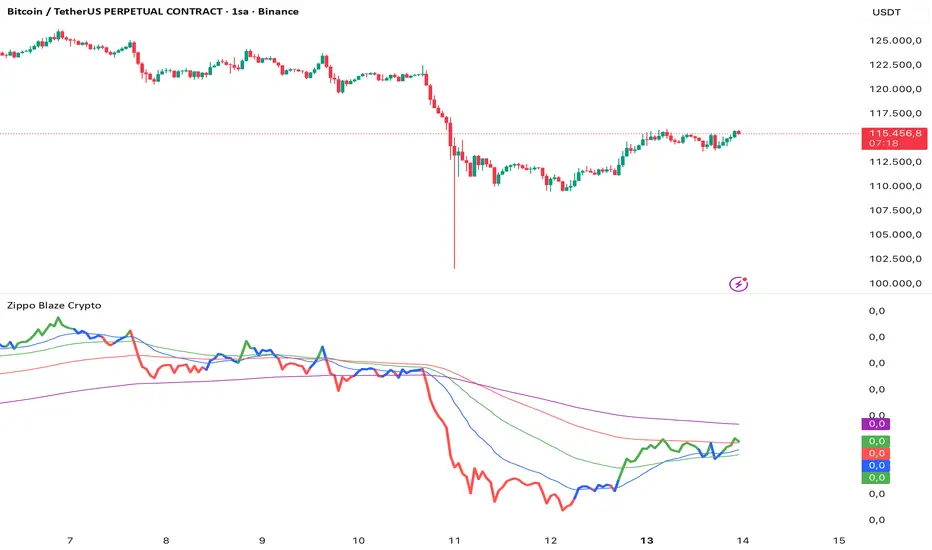
Zippo Blaze Crypto
An advanced trend-following indicator that analyzes cryptocurrency price movements by integrating them with major pairs (BTC, ETH, BNB, etc.). It combines the price with these pairs and overall market dynamics to create a main line, colors this line based on momentum, and adds user-adjustable EMAs on top. This provides a balanced trend analysis by considering connections in the crypto market. It only works for cryptocurrencies; it shows no data for other assets (e.g., Borsa Istanbul stocks).
How It Works?
This system operates using a special method that combines crypto prices with major pairs (like BTC, ETH, BNB) and the price itself:
- Price Movement Line: The main line created by normalizing the crypto price with pairs and market data – it shows movement with major coins, but moves in tandem with the price (the line rises when the price rises, falls when it falls) and synchronizes with pairs.
-- Coloring: Determined based on momentum:
🟢 Green: Upward momentum – upward price movement expected.
🔴 Red: Downward momentum – downward price movement expected.
🔵 Blue: Neutral zone – horizontal movement or uncertainty period.
-- EMAs: Moving averages added on top of the main line (EMA 20, 50, 100, 200). Periods can be changed by the user; other calculations are fixed.
This method strengthens signals by utilizing the interconnected structure of the market and reduces optimization risk.
Key Features:
Pair Integration: Integrates price movement with major pairs like BTC, ETH, BNB, providing a connected view instead of an isolated analysis.
Momentum Coloring: Colors the line for quick trend detection – green and red zones give clear signals.
Verification Tools: EMAs verify the direction of the main line; for example, EMAs turning upward can be used as a long signal, downward as a short signal.
Price Action Levels: When viewed on larger time frames (daily, weekly), important support/resistance levels (PA levels) become more apparent.
Crypto-Focused: Only activates on crypto symbols; remains blank in other markets.
How to Use?
-- Price Movement Line: Main trend indicator – moves in sync with pairs, signals long opportunities in uptrends, short in downtrends.
🟢 Green Line: Upward movement expected (evaluate long positions).
🔴 Red Line: Downward movement expected (evaluate short positions).
🔵 Blue Line: Horizontal or neutral period – avoid opening new positions.
- EMAs: Line and EMA crossovers confirm signals; EMAs turning upward can be interpreted as a long signal, downward as short. Monitor PA levels with EMAs on larger periods.
Time Frame and Usage Recommendations
Best results are achieved on hourly and higher time frames (e.g., 1H, 4H, daily), as pair integration and price movement are clearer in these frames.
Signals may weaken in low-liquidity altcoins; ideal for major cryptocurrencies (BTC, ETH, BNB, etc.).
Use EMAs to detect PA levels on larger periods (daily+) – this provides an advantage in long-term trades.
In short time frames, adjust EMA periods for filtering.
Important Warning
This indicator is developed for technical analysis purposes and does not contain investment advice. Market conditions can change rapidly; even pair integration cannot provide full protection against instant fluctuations. Make all your investment decisions based on your own research, risk management strategies, and professional advice.
סקריפט להזמנה בלבד
רק משתמשים שאושרו על ידי המחבר יכולים לגשת לסקריפט הזה. תצטרך לבקש ולקבל אישור להשתמש בו. אישור זה ניתן בדרך כלל לאחר תשלום. לפרטים נוספים, בצע את ההוראות של המחבר למטה או צור קשר ישירות עם Zippo_Javie.
TradingView לא ממליצה לשלם עבור סקריפט או להשתמש בו, אלא אם כן אתה סומך לחלוטין על המחבר שלו ומבין איך הוא עובד. ייתכן שתמצא גם אלטרנטיבות חינמיות בקוד פתוח בסקריפטים של הקהילה שלנו.
הוראות המחבר
כתב ויתור
סקריפט להזמנה בלבד
רק משתמשים שאושרו על ידי המחבר יכולים לגשת לסקריפט הזה. תצטרך לבקש ולקבל אישור להשתמש בו. אישור זה ניתן בדרך כלל לאחר תשלום. לפרטים נוספים, בצע את ההוראות של המחבר למטה או צור קשר ישירות עם Zippo_Javie.
TradingView לא ממליצה לשלם עבור סקריפט או להשתמש בו, אלא אם כן אתה סומך לחלוטין על המחבר שלו ומבין איך הוא עובד. ייתכן שתמצא גם אלטרנטיבות חינמיות בקוד פתוח בסקריפטים של הקהילה שלנו.