PROTECTED SOURCE SCRIPT
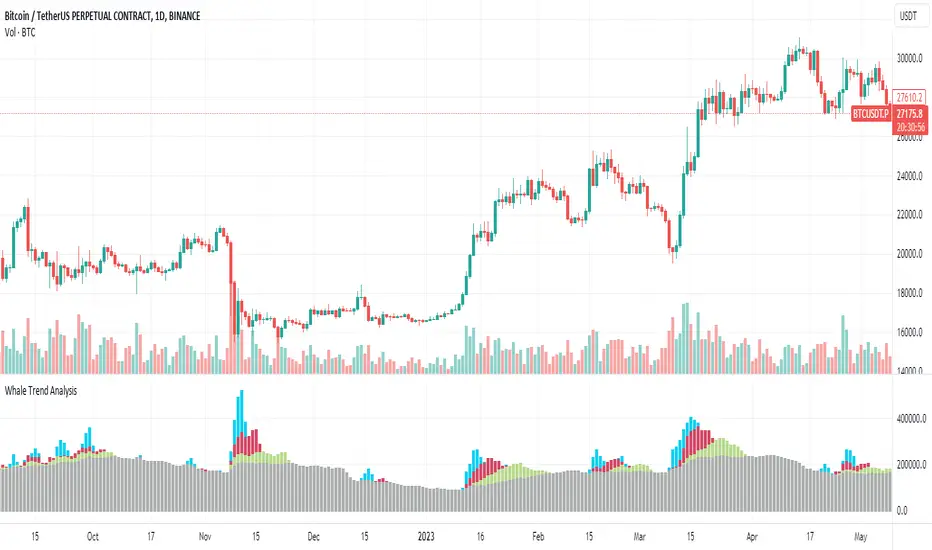
Whale Trend Analysis
Large entity and whales are always smart, they hide in the market to make money. Learning how they operate, we will become smarter. How to distinguish the structure of participants, find the large entities or giant whales, this is a difficult problem.
Indicators: Whale Trend Analysis, using AI algorithms to find them.
⏩Principle overview:
The core of Whale Trend Analysis is trading volume. By subdividing the cumulative value of trading volume in different periods and price, algorithm-weighted splitting is performed on ultra-large trading volume, large trading volume, medium trading volume and small trading volume to distinguish each magnitude is subdivided from the four dimensions of large entities, whales, large investors, and retail investors, effectively exploring the main trading entities.
⏩Usage:
4 characters:
· "Light blue column": represents the trading volume of large entities.
· "Red column": represents the trading volume of whales.
· "Green column": represents the trading volume of large investors.
· "Gray column": represents the trading volume of retail investors.

🧿Tip I:
Identify upside willingness. When the market is rising and the column representing large entities and whales appear, it means that the willingness to buy is strong, and the market is rising healthily at this time.
However, when the market continues to rise,but large entities and whales disappear, and only retail investors are trading intensively. At this time, we need to be vigilant. Large entities and whales may be quietly leaving the market, so don’t be cut off.

🧿Tip II:
Recognize bottom-buying sentiment. Most retail investors stop loss and leave the market at the end of the decline, which is the favorite scene of large entities and whales, because they can pick up a lot of cheap chips.
When falling, pay attention to their movements. If the blue and red column that represent large entities and whales appear frequently, it means that they are actively buying. It is possible that the downward momentum will weaken and usher in a short-term bottom.

🧿Tip III:
This indicator is an open indicator that describes the trading methods and participation time of participants at all levels. There are different forms of expression in fluctuation, trends, rises, and falls. It cannot be generalized, and must be analyzed with reference to the market sentiment at that time.
*The signals in the indicators are for reference only and not intended as investment advice. Past performance of a strategy is not indicative of future earnings results.
Indicators: Whale Trend Analysis, using AI algorithms to find them.
⏩Principle overview:
The core of Whale Trend Analysis is trading volume. By subdividing the cumulative value of trading volume in different periods and price, algorithm-weighted splitting is performed on ultra-large trading volume, large trading volume, medium trading volume and small trading volume to distinguish each magnitude is subdivided from the four dimensions of large entities, whales, large investors, and retail investors, effectively exploring the main trading entities.
⏩Usage:
4 characters:
· "Light blue column": represents the trading volume of large entities.
· "Red column": represents the trading volume of whales.
· "Green column": represents the trading volume of large investors.
· "Gray column": represents the trading volume of retail investors.
🧿Tip I:
Identify upside willingness. When the market is rising and the column representing large entities and whales appear, it means that the willingness to buy is strong, and the market is rising healthily at this time.
However, when the market continues to rise,but large entities and whales disappear, and only retail investors are trading intensively. At this time, we need to be vigilant. Large entities and whales may be quietly leaving the market, so don’t be cut off.
🧿Tip II:
Recognize bottom-buying sentiment. Most retail investors stop loss and leave the market at the end of the decline, which is the favorite scene of large entities and whales, because they can pick up a lot of cheap chips.
When falling, pay attention to their movements. If the blue and red column that represent large entities and whales appear frequently, it means that they are actively buying. It is possible that the downward momentum will weaken and usher in a short-term bottom.
🧿Tip III:
This indicator is an open indicator that describes the trading methods and participation time of participants at all levels. There are different forms of expression in fluctuation, trends, rises, and falls. It cannot be generalized, and must be analyzed with reference to the market sentiment at that time.
*The signals in the indicators are for reference only and not intended as investment advice. Past performance of a strategy is not indicative of future earnings results.
סקריפט מוגן
סקריפט זה פורסם כמקור סגור. עם זאת, תוכל להשתמש בו בחופשיות וללא כל מגבלות – למד עוד כאן
כתב ויתור
המידע והפרסומים אינם מיועדים להיות, ואינם מהווים, ייעוץ או המלצה פיננסית, השקעתית, מסחרית או מכל סוג אחר המסופקת או מאושרת על ידי TradingView. קרא עוד ב־תנאי השימוש.
סקריפט מוגן
סקריפט זה פורסם כמקור סגור. עם זאת, תוכל להשתמש בו בחופשיות וללא כל מגבלות – למד עוד כאן
כתב ויתור
המידע והפרסומים אינם מיועדים להיות, ואינם מהווים, ייעוץ או המלצה פיננסית, השקעתית, מסחרית או מכל סוג אחר המסופקת או מאושרת על ידי TradingView. קרא עוד ב־תנאי השימוש.