OPEN-SOURCE SCRIPT
מעודכן Donchian Channels with Strategy
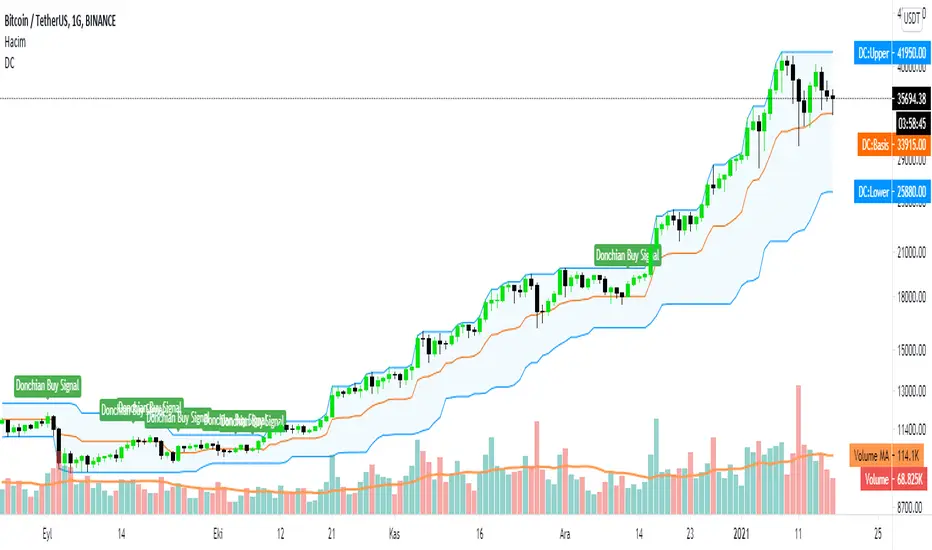
Donchian Channels are three lines generated by moving average calculations that comprise an indicator formed by upper and lower bands around a mid-range or median band. The upper band marks the highest price of a security over N periods while the lower band marks the lowest price of a security over N periods. The area between the upper and lower bands represents the Donchian Channel. Career futures trader Richard Donchian developed the indicator in the mid-twentieth century to help him identify trends. He would later be nicknamed "The Father of Trend Following."
How To Calculate Donchian Channels
Channel High:
Choose time period (N minutes/hours/days/weeks/months).
Compare the high print for each minute, hour, day, week or month over that period.
Choose the highest print.
Plot the result.
Channel Low:
Choose time period (N minutes/hours/days/weeks/months).
Compare the low print for each minute, hour, day, week or month over that period.
Choose the lowest print.
Plot the result.
Center Channel:
Choose time period (N minutes/hours/days/weeks/months).
Compare high and low prints for each minute, hour, day, week or month over that period.
Subtract the highest high print from lowest low print and divide by 2.
Plot the result.
This scripts gives you to alerts
If price above the center channel this means BUY and script tells you are at the BUY ZONE
הערות שחרור
In this version we changed some tickets name and made some bug fixes.סקריפט קוד פתוח
ברוח האמיתית של TradingView, יוצר הסקריפט הזה הפך אותו לקוד פתוח, כך שסוחרים יוכלו לעיין בו ולאמת את פעולתו. כל הכבוד למחבר! אמנם ניתן להשתמש בו בחינם, אך זכור כי פרסום חוזר של הקוד כפוף ל־כללי הבית שלנו.
כתב ויתור
המידע והפרסומים אינם מיועדים להיות, ואינם מהווים, ייעוץ או המלצה פיננסית, השקעתית, מסחרית או מכל סוג אחר המסופקת או מאושרת על ידי TradingView. קרא עוד ב־תנאי השימוש.
סקריפט קוד פתוח
ברוח האמיתית של TradingView, יוצר הסקריפט הזה הפך אותו לקוד פתוח, כך שסוחרים יוכלו לעיין בו ולאמת את פעולתו. כל הכבוד למחבר! אמנם ניתן להשתמש בו בחינם, אך זכור כי פרסום חוזר של הקוד כפוף ל־כללי הבית שלנו.
כתב ויתור
המידע והפרסומים אינם מיועדים להיות, ואינם מהווים, ייעוץ או המלצה פיננסית, השקעתית, מסחרית או מכל סוג אחר המסופקת או מאושרת על ידי TradingView. קרא עוד ב־תנאי השימוש.