OPEN-SOURCE SCRIPT
Volume Reversals

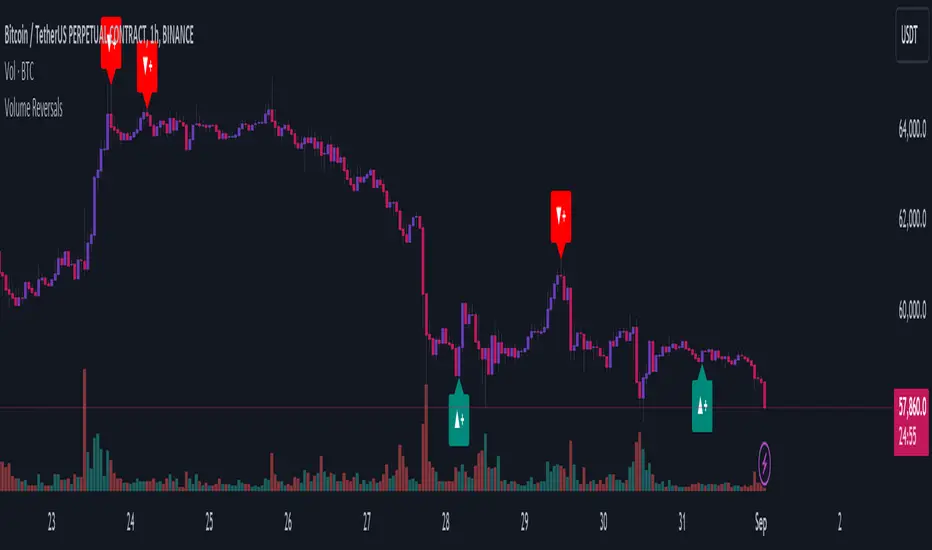
The "Volume Reversals" indicator is a trading tool designed to identify potential buy and sell signals based on volume patterns.
Features
Filter Signals : Traders can enable or disable additional filtering of signals, which refines the conditions under which buy and sell labels are displayed.
Buy and Sell Labels: The indicator dynamically places labels on the chart to signify buy ("▲+") and sell ("▼+") opportunities. Buy labels appear at low points of bars with a green upward-pointing arrow, while sell labels appear at high points with a red downward-pointing arrow.
Customizable Alerts: Users can set alerts for buy and sell signals, receiving notifications when conditions match predefined patterns.
Logic Explained
This indicator is suited for various assets and timeframes, especially in markets where volume plays a significant role in price dynamics.
Features
Filter Signals : Traders can enable or disable additional filtering of signals, which refines the conditions under which buy and sell labels are displayed.
Buy and Sell Labels: The indicator dynamically places labels on the chart to signify buy ("▲+") and sell ("▼+") opportunities. Buy labels appear at low points of bars with a green upward-pointing arrow, while sell labels appear at high points with a red downward-pointing arrow.
Customizable Alerts: Users can set alerts for buy and sell signals, receiving notifications when conditions match predefined patterns.
Logic Explained
- Volume Comparison: The script examines a sequence of the last five volume bars to detect increasing or decreasing trends.
- Price Action Analysis: Each volume bar is paired with a corresponding price action (bullish or bearish) from the same period.
- Signal Conditions: A signal is generated under two scenarios:
- Normal Conditions: Sequential increase/decrease in volume over three bars accompanied by bearish/bullish price action, followed by a dip in volume with a bullish/bearish bar.
- Filtered Conditions (if filter is active): Requires all last four bars to be bearish/bullish, the most recent bar's volume to be less than the immediate previous, and then exceeds the volume two bars prior, closing bullish/bearish.
This indicator is suited for various assets and timeframes, especially in markets where volume plays a significant role in price dynamics.
סקריפט קוד פתוח
ברוח האמיתית של TradingView, יוצר הסקריפט הזה הפך אותו לקוד פתוח, כך שסוחרים יוכלו לעיין בו ולאמת את פעולתו. כל הכבוד למחבר! אמנם ניתן להשתמש בו בחינם, אך זכור כי פרסום חוזר של הקוד כפוף ל־כללי הבית שלנו.
כתב ויתור
המידע והפרסומים אינם מיועדים להיות, ואינם מהווים, ייעוץ או המלצה פיננסית, השקעתית, מסחרית או מכל סוג אחר המסופקת או מאושרת על ידי TradingView. קרא עוד ב־תנאי השימוש.