OPEN-SOURCE SCRIPT
מעודכן VPT and Heiken Ashi Candles MTF
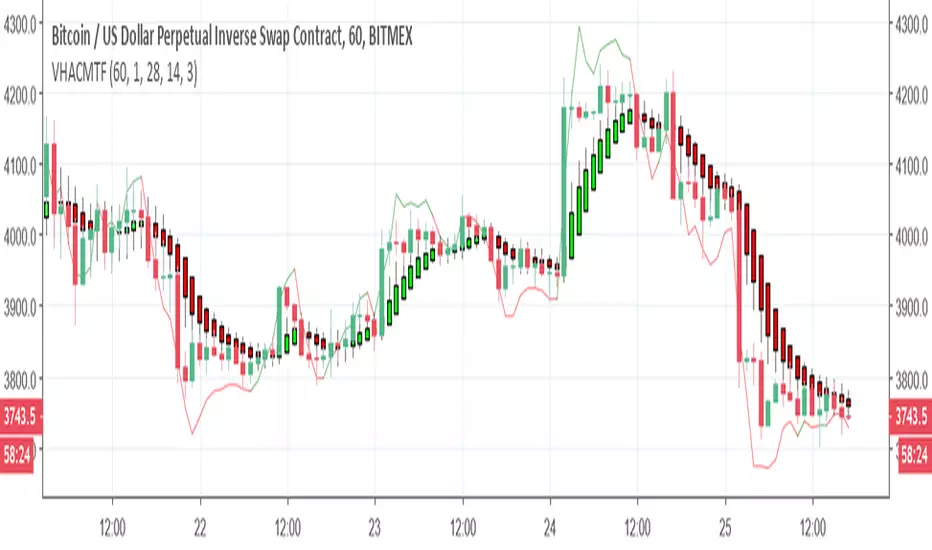
The volume price trend indicator is used to determine the balance between a security’s demand and supply. The percentage change in the share price trend shows the relative supply or demand of a particular security, while volume indicates the force behind the trend. The VPT indicator is similar to the on-balance volume (OBV) indicator in that it measures cumulative volume and provides traders with information about a security’s money flow
So we put the VPT and add HA candles with non repainting MTF , the crossing up or down of the VPT over candles create the signals
since VPT tend to overshoot you can smooth it with Leni..(just give the smoothing of the length this stupid name:) )
alerts inside

just example of play with MTF and the smooth of VPT
So we put the VPT and add HA candles with non repainting MTF , the crossing up or down of the VPT over candles create the signals
since VPT tend to overshoot you can smooth it with Leni..(just give the smoothing of the length this stupid name:) )
alerts inside
just example of play with MTF and the smooth of VPT
הערות שחרור
I remove the signals as it probably repainting , the HA need to be converted to version 3 probably , sorry for thisסקריפט קוד פתוח
ברוח האמיתית של TradingView, יוצר הסקריפט הזה הפך אותו לקוד פתוח, כך שסוחרים יוכלו לעיין בו ולאמת את פעולתו. כל הכבוד למחבר! אמנם ניתן להשתמש בו בחינם, אך זכור כי פרסום חוזר של הקוד כפוף ל־כללי הבית שלנו.
כתב ויתור
המידע והפרסומים אינם מיועדים להיות, ואינם מהווים, ייעוץ או המלצה פיננסית, השקעתית, מסחרית או מכל סוג אחר המסופקת או מאושרת על ידי TradingView. קרא עוד ב־תנאי השימוש.
סקריפט קוד פתוח
ברוח האמיתית של TradingView, יוצר הסקריפט הזה הפך אותו לקוד פתוח, כך שסוחרים יוכלו לעיין בו ולאמת את פעולתו. כל הכבוד למחבר! אמנם ניתן להשתמש בו בחינם, אך זכור כי פרסום חוזר של הקוד כפוף ל־כללי הבית שלנו.
כתב ויתור
המידע והפרסומים אינם מיועדים להיות, ואינם מהווים, ייעוץ או המלצה פיננסית, השקעתית, מסחרית או מכל סוג אחר המסופקת או מאושרת על ידי TradingView. קרא עוד ב־תנאי השימוש.