PROTECTED SOURCE SCRIPT
Electricity Futures x DAM Window Tracking
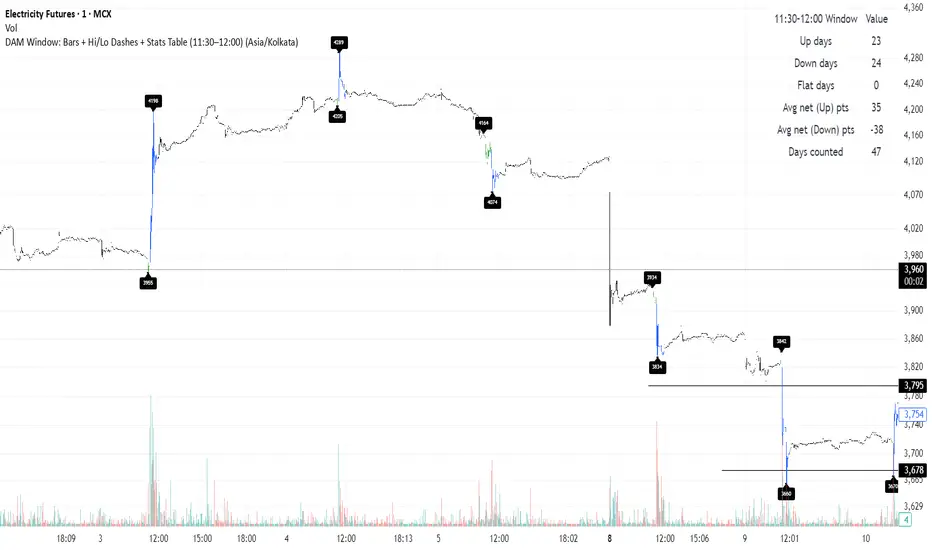
What this one script does
Tracks the OHLC during 11:30–12:00 window per day
Colors bars
11:30–11:45 → Green
11:45–12:00 → Blue
Draws
A horizontal dash at the High and at the Low along with price labels.
Displays a table
Up days - count of days when prices went up post event
Down days - count of days when prices went down post event
Flat days
Avg net change (points) on up days - average of net change on up days
Avg net change (points) on down days - average of net change on down days
Works on 1m / 5m / 15m charts only.
סקריפט מוגן
סקריפט זה פורסם כמקור סגור. עם זאת, תוכל להשתמש בו בחופשיות וללא כל מגבלות – למד עוד כאן
כתב ויתור
המידע והפרסומים אינם מיועדים להיות, ואינם מהווים, ייעוץ או המלצה פיננסית, השקעתית, מסחרית או מכל סוג אחר המסופקת או מאושרת על ידי TradingView. קרא עוד ב־תנאי השימוש.
סקריפט מוגן
סקריפט זה פורסם כמקור סגור. עם זאת, תוכל להשתמש בו בחופשיות וללא כל מגבלות – למד עוד כאן
כתב ויתור
המידע והפרסומים אינם מיועדים להיות, ואינם מהווים, ייעוץ או המלצה פיננסית, השקעתית, מסחרית או מכל סוג אחר המסופקת או מאושרת על ידי TradingView. קרא עוד ב־תנאי השימוש.