OPEN-SOURCE SCRIPT
מעודכן Earnings X-Ray
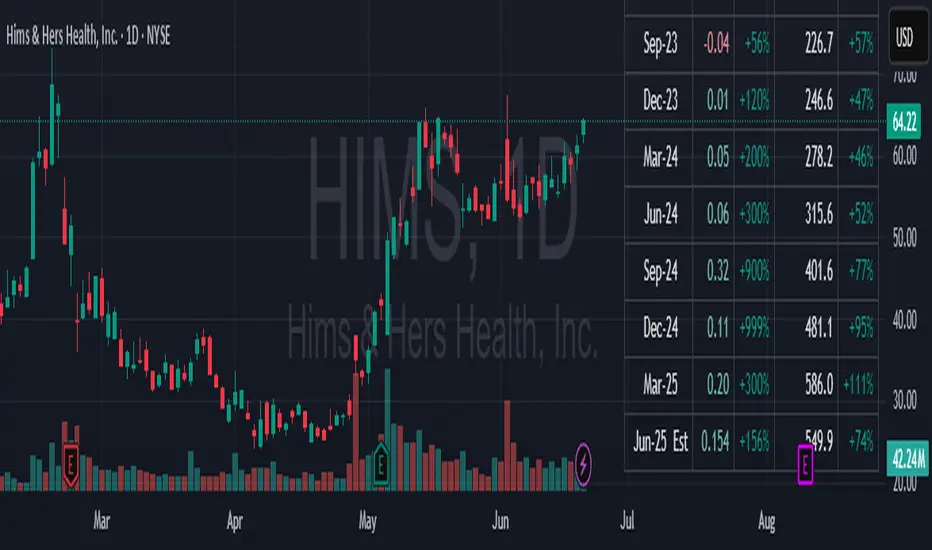
The script presents earnings and revenues in a tabular format. Particularly, it calculates percentage changes.
Earnings data can be found in TradingView Financials. However, percentage changes are not provided. Can TradingView implement this in the future?
Displaying earnings table on the chart has its benefits. No additional clicks required to access the data. This significantly streamlines the stock scanning process.
It is important to quickly evaluate a company's earnings when scanning for stocks. The script provides this capability.
Similar scripts have been created previously. This script corrects calculations and improves presentation with the concise code.
Data access:
Earnings = request.earnings(syminfo.tickerid, earnings.actual)
FutureEarnings = earnings.future_eps
FutureRevenue = earnings.future_revenue
Can more than one quarter of future earnings estimates become available in Pine Script in the future?
The script was validated against MarketSurge.
Features:
- Quarterly or Yearly data
- Configurable number of fiscal periods
- Configurable location on the chart
- Optional Dark mode
הערות שחרור
Bug fixes. Dark mode is now automatic. Optional color the for EPS column.הערות שחרור
Converted to Pine Script v6.Added Transparency setting.
Handled edge case for missing revenue value just after earnings release.
הערות שחרור
Minor bug fix.הערות שחרור
Update the chartסקריפט קוד פתוח
ברוח האמיתית של TradingView, יוצר הסקריפט הזה הפך אותו לקוד פתוח, כך שסוחרים יוכלו לעיין בו ולאמת את פעולתו. כל הכבוד למחבר! אמנם ניתן להשתמש בו בחינם, אך זכור כי פרסום חוזר של הקוד כפוף ל־כללי הבית שלנו.
כתב ויתור
המידע והפרסומים אינם מיועדים להיות, ואינם מהווים, ייעוץ או המלצה פיננסית, השקעתית, מסחרית או מכל סוג אחר המסופקת או מאושרת על ידי TradingView. קרא עוד ב־תנאי השימוש.
סקריפט קוד פתוח
ברוח האמיתית של TradingView, יוצר הסקריפט הזה הפך אותו לקוד פתוח, כך שסוחרים יוכלו לעיין בו ולאמת את פעולתו. כל הכבוד למחבר! אמנם ניתן להשתמש בו בחינם, אך זכור כי פרסום חוזר של הקוד כפוף ל־כללי הבית שלנו.
כתב ויתור
המידע והפרסומים אינם מיועדים להיות, ואינם מהווים, ייעוץ או המלצה פיננסית, השקעתית, מסחרית או מכל סוג אחר המסופקת או מאושרת על ידי TradingView. קרא עוד ב־תנאי השימוש.