OPEN-SOURCE SCRIPT
מעודכן Buy/Sell Alert EMA with SuperFormula by zdmre

*** Use it at your own risk
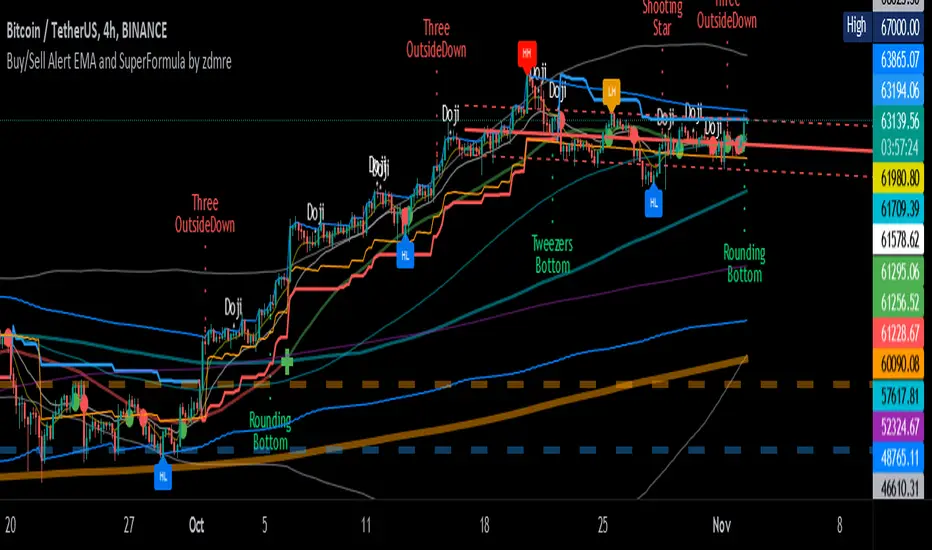
This indicator has 3 indicators and gives a buy/sell signal depending on the EMA.
3 indicators:
It also shows the value on the candle as a warning in the Buy and Sell signals. This value is calculated with a special formula I have created.
On the other hand Bollinger Band and Ichimoku Cloud are also included to check the accuracy of the signals.
For this indicator, I recommend a minimum of 4 hours chart.
This indicator has 3 indicators and gives a buy/sell signal depending on the EMA.
3 indicators:
- - Ichimoku
- - Bollinger Band
- - EMA
It also shows the value on the candle as a warning in the Buy and Sell signals. This value is calculated with a special formula I have created.
On the other hand Bollinger Band and Ichimoku Cloud are also included to check the accuracy of the signals.
For this indicator, I recommend a minimum of 4 hours chart.
הערות שחרור
v 2.0-adding THEIL-SEN ESTIMATOR @tbiktag (Thanks my friend)
-changing default EMA values to 8-20
הערות שחרור
Release Notes: v 3.0-Adding Bitcoin Investor Tool: 2-Year MA Multiplier + 1-Year MA
-Adding Pi Cycle Top Indicator
הערות שחרור
Release Notes: Release Notes: v 4.0-Adding KAMA Indicator
-Adding Cup Indicator
הערות שחרור
Max bar problem fixed.Trailing Stop Loss improved.
"Show Buy/Sell Signals" added. Default value=true
"Show Calculation Values" added. Default value=false
הערות שחרור
Improved RSI, Sell Point, Calc Value Label.Added "Show TrailingSTOP Prices" label.
הערות שחרור
Updated PineScript version 5Added Pattern Trend Calculations (Fibonacci, RSI, DMI)
Added Flagging
Added ZigZag (HH-HL-LH-LL)
Added Tables
Added Advanced Patterns
and more
הערות שחרור
Removed KAMA,Removed Cup,
Removed Pattern Trend Calculations (Fibonacci, RSI, DMI)
Removed Tables,
Added Advanced Patterns
Added Cup and Handle.
Optimization and Visual improvements.
הערות שחרור
Bug fixes.סקריפט קוד פתוח
ברוח האמיתית של TradingView, יוצר הסקריפט הזה הפך אותו לקוד פתוח, כך שסוחרים יוכלו לעיין בו ולאמת את פעולתו. כל הכבוד למחבר! אמנם ניתן להשתמש בו בחינם, אך זכור כי פרסום חוזר של הקוד כפוף ל־כללי הבית שלנו.
כתב ויתור
המידע והפרסומים אינם מיועדים להיות, ואינם מהווים, ייעוץ או המלצה פיננסית, השקעתית, מסחרית או מכל סוג אחר המסופקת או מאושרת על ידי TradingView. קרא עוד ב־תנאי השימוש.
סקריפט קוד פתוח
ברוח האמיתית של TradingView, יוצר הסקריפט הזה הפך אותו לקוד פתוח, כך שסוחרים יוכלו לעיין בו ולאמת את פעולתו. כל הכבוד למחבר! אמנם ניתן להשתמש בו בחינם, אך זכור כי פרסום חוזר של הקוד כפוף ל־כללי הבית שלנו.
כתב ויתור
המידע והפרסומים אינם מיועדים להיות, ואינם מהווים, ייעוץ או המלצה פיננסית, השקעתית, מסחרית או מכל סוג אחר המסופקת או מאושרת על ידי TradingView. קרא עוד ב־תנאי השימוש.