OPEN-SOURCE SCRIPT
מעודכן 🟥 Synthetic 10Y Real Yield (US10Y - Breakeven)
This script calculates and plots a synthetic U.S. 10-Year Real Yield by subtracting the 10-Year Breakeven Inflation Rate (USGGBE10) from the nominal 10-Year Treasury Yield (US10Y).
Real yields are a core macro driver for gold, crypto, growth stocks, and bond pricing, and are closely monitored by institutional traders.
The script includes key reference lines:
0% = Below zero = deeply accommodative regime
1.5% = Common threshold used by macro desks to evaluate gold upside breakout conditions
📈 Use this to monitor macro shifts in real-time and front-run capital flows during major CPI, NFP, and Fed events.
Update Frequency: Daily (based on Treasury market data)
הערות שחרור
This script calculates and plots a synthetic U.S. 10-Year Real Yield by subtracting the 10-Year Breakeven Inflation Rate (USGGBE10) from the nominal 10-Year Treasury Yield (US10Y).Real yields are a core macro driver for gold, crypto, growth stocks, and bond pricing, and are closely monitored by institutional traders.
The script includes key reference lines:
0% = Below zero = deeply accommodative regime
1.5% = Common threshold used by macro desks to evaluate gold upside breakout conditions
📈 Use this to monitor macro shifts in real-time and front-run capital flows during major CPI, NFP, and Fed events.
Update Frequency: Daily (based on Treasury market data
הערות שחרור
Real Yield Overlay (Gold-Scaled View)Author: [Saraicy]
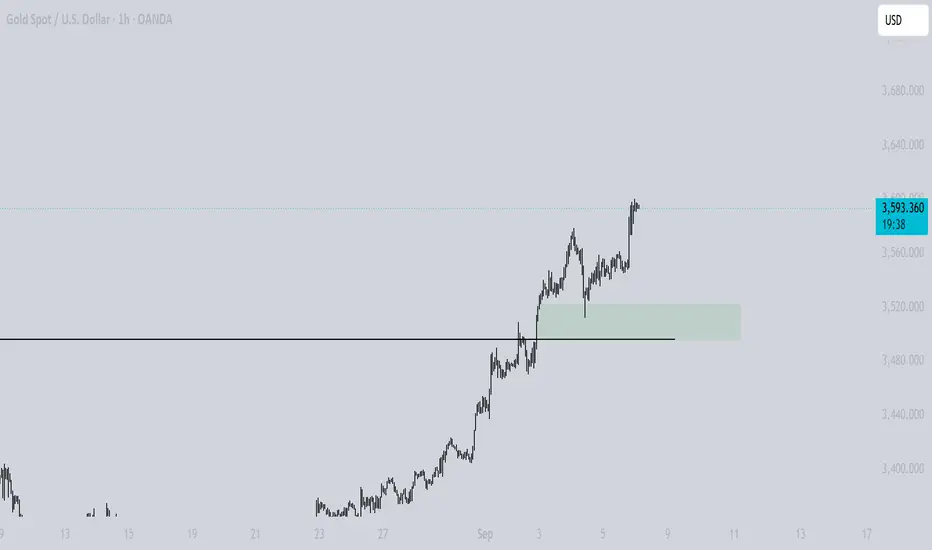
This script overlays the U.S. 10-Year Real Yield directly onto your price chart (e.g. Gold), scaled and aligned to current price levels for intuitive macro correlation tracking.
📈 How it works:
Real Yield Calculation = Nominal 10Y Treasury Yield (FRED:GS10) − 10Y Breakeven Inflation Rate (FRED:T10YIE)
The result is scaled using a custom slope to reflect 0.1% real yield ≈ 200 price units (adjustable).
Overlay is anchored to a reference real yield and price (e.g. 1.6% at 3400), making real yield fluctuations visually interpretable alongside gold price movement.
A dynamic label shows current real yield (%) on the main chart, aligned with price action.
🔍 Use case:
This tool is designed for macro-informed traders, especially gold, Bitcoin, and rates traders, to:
Track inverse correlation between real yields and gold
Visualize monetary policy shifts and bond market reactions in price space
Aid real-time narrative building around inflation, recession risk, and Fed cuts
⚙️ Customizable inputs (in code):
anchor_yield: The real yield to anchor scaling to
anchor_price: The chart price to align with anchor yield
slope: Determines how dramatically real yield changes appear (default: 0.1% = 200pts)
הערות שחרור
### **Real Yield Overlay (Gold-Scaled View)****Author:** [Saraicy]
This script overlays the **U.S. 10-Year Real Yield** directly onto your price chart (e.g. Gold), scaled and aligned to current price levels for intuitive macro correlation tracking.
---
### 📈 **How it works:**
- **Real Yield Calculation** = Nominal 10Y Treasury Yield (FRED:GS10) − 10Y Breakeven Inflation Rate (FRED:T10YIE)
- The result is **scaled** using a custom slope to reflect **0.1% real yield ≈ 200 price units** (adjustable).
- Overlay is anchored to a **reference real yield** and **price** (e.g. 1.6% at 3400), making real yield fluctuations visually interpretable alongside gold price movement.
- A **dynamic label** shows current real yield (%) on the main chart, aligned with price action.
---
### 🔍 **Use case:**
This tool is designed for **macro-informed traders**, especially gold, Bitcoin, and rates traders, to:
- Track **inverse correlation** between real yields and gold
- Visualize **monetary policy shifts** and bond market reactions in price space
- Aid real-time narrative building around inflation, recession risk, and Fed cuts
---
### ⚙️ **Customizable inputs (in code):**
- `anchor_yield`: The real yield to anchor scaling to
- `anchor_price`: The chart price to align with anchor yield
- `slope`: Determines how dramatically real yield changes appear (default: 0.1% = 200pts)
סקריפט קוד פתוח
ברוח האמיתית של TradingView, יוצר הסקריפט הזה הפך אותו לקוד פתוח, כך שסוחרים יוכלו לעיין בו ולאמת את פעולתו. כל הכבוד למחבר! אמנם ניתן להשתמש בו בחינם, אך זכור כי פרסום חוזר של הקוד כפוף ל־כללי הבית שלנו.
כתב ויתור
המידע והפרסומים אינם מיועדים להיות, ואינם מהווים, ייעוץ או המלצה פיננסית, השקעתית, מסחרית או מכל סוג אחר המסופקת או מאושרת על ידי TradingView. קרא עוד ב־תנאי השימוש.