PROTECTED SOURCE SCRIPT
PROFABIGHI_CAPITAL Ratio
🌟 Overview
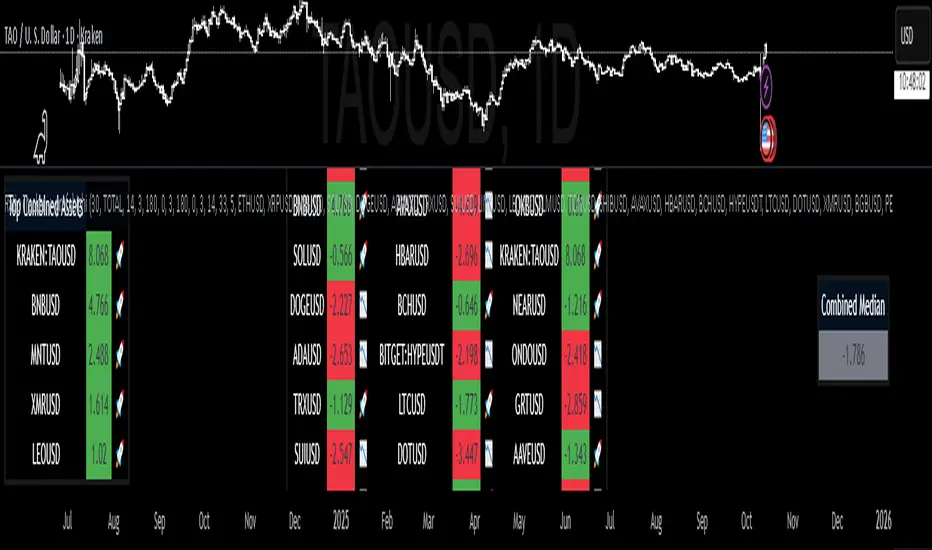
The PROFABIGHI_CAPITAL Ratio Tracker is a comprehensive multi-asset performance dashboard designed for cryptocurrency portfolio analysis, evaluating up to 33 altcoins against a customizable benchmark using six key quantitative metrics: alpha for excess returns, beta for relative volatility, Sharpe ratio for overall risk-adjusted performance, Sortino ratio for downside risk focus, omega ratio for probability-weighted gain-loss assessment, and rate of change (ROC) for momentum tracking. It aggregates these metrics into unified composite scores for each asset, enabling traders to rank and compare opportunities through intuitive table-based visualizations, median benchmarking, and top-performer highlights, all while supporting selective metric activation, adjustable parameters, and real-time alerts for systematic decision-making in volatile markets.
⚙️ Metrics Selection
- Toggle for enabling alpha calculations to quantify an asset's unique performance beyond benchmark movements, ideal for identifying true outperformance in diversified portfolios
- Toggle for activating beta measurements to evaluate how closely an asset mirrors benchmark volatility, helping assess diversification benefits or leverage exposure
- Toggle for incorporating Sharpe ratio to measure returns per unit of total risk, providing a standardized benchmark for comparing asset efficiency across varying volatility profiles
- Toggle for including Sortino ratio to emphasize returns adjusted for harmful downside moves only, particularly useful in asymmetric markets like crypto where upside swings are desirable
- Toggle for utilizing omega ratio to analyze the full return distribution by weighting probable gains against losses relative to a target threshold, capturing tail risks and skewness effects
- Toggle for adding rate of change to capture short-term momentum trends, complementing longer-term risk metrics with directional conviction signals
- Modular activation allows traders to tailor the analysis to specific philosophies, such as risk-averse setups focusing on Sortino and omega or momentum-driven approaches emphasizing ROC alongside Sharpe
- Computational efficiency through conditional enabling, ensuring only selected metrics consume resources while maintaining flexibility for evolving market conditions or strategy refinements
🎯 Alpha and Beta Parameters
- Adjustable lookback period for alpha and beta computations, balancing statistical robustness with responsiveness—longer horizons smooth noise for stable estimates, shorter ones highlight recent regime shifts
- Customizable benchmark symbol selection, such as broad market cap indices or sector-specific aggregates, to define the reference for relative performance evaluation and ensure meaningful comparisons
- Alpha derivation as the intercept in a regression of asset returns against benchmark returns, revealing skill-based outperformance after accounting for systematic market exposure
- Beta estimation via covariance divided by benchmark variance, quantifying sensitivity to market moves—values above 1 signal amplified volatility for growth-oriented allocations, below 1 indicate defensive traits
- Shared lookback application across both metrics for consistency, with higher values promoting trend-following reliability and lower values enabling tactical adjustments to intraday or weekly dynamics
- Conditional benchmark data fetching only when alpha or beta is active, optimizing script performance by avoiding unnecessary external data requests in lightweight configurations
- Tooltip-guided parameter explanations emphasizing trade-offs between smoothness and reactivity, aiding users in aligning settings with their timeframe and risk tolerance
- Integration with daily return series for precise regression inputs, ensuring calculations reflect realistic percentage-based movements rather than absolute price changes
⚡ Sharpe Ratio Parameters
- Rolling period for mean return and volatility estimation, where shorter windows capture recent performance spikes for agile monitoring, and longer ones provide trend-stable assessments
- Exponential moving average smoothing length to filter daily fluctuations in raw ratios, reducing visual noise while preserving signals of genuine risk-return shifts
- Daily return computation via price changes divided by prior close, standardizing inputs for cross-asset comparability regardless of nominal price levels
- Mean return via simple moving average over the period, representing average daily excess as the reward component in the risk-adjusted formula
- Standard deviation of returns as the risk denominator, capturing total volatility including both upside and downside deviations for holistic efficiency gauging
- Raw ratio as mean divided by standard deviation, with zero-volatility safeguards to prevent errors during flat periods, defaulting to neutral performance
- Annualization through multiplication by the square root of 365, converting daily metrics to yearly equivalents for intuitive benchmarking against industry standards
- Smoothed and annualized output for each asset, enabling direct ranking of risk efficiency—higher values highlight superior return generation per volatility unit
🎯 Sortino Ratio Parameters
- Extended lookback for downside deviation accumulation, favoring longer periods for reliable negative return sampling in sporadic drawdown environments
- Annual risk-free rate input as the downside threshold, adjustable to reflect opportunity costs like bond yields or inflation, with zero default treating all losses as harmful
- Smoothing period via EMA to stabilize the ratio against window shifts, mirroring Sharpe approach but tailored to the selective nature of downside focus
- Periodic returns calculated as close-to-prior ratios minus one, ensuring percentage consistency for multi-asset analysis
- Effective period adaptation to available bars, allowing early calculations with shorter windows that expand over time for progressive accuracy
- Downside squared deviations summed only for underperformance instances, divided by period count, then square-rooted for standard deviation equivalent
- Raw ratio as excess mean return over downside deviation, scaled annually via square root scaling, emphasizing protection against capital erosion
- Smoothed final values per asset, rewarding strategies that minimize harmful volatility while ignoring beneficial upside dispersion common in crypto rallies
🔄 Omega Ratio Parameters
- Calculation period for return distribution sampling, longer horizons capturing fuller gain-loss spectra for robust probability weighting
- Target return threshold per period, defining success boundaries—zero treats positives as gains, positives add hurdles for conservative analysis
- EMA smoothing to dampen ratio swings from individual extreme returns entering or exiting the window, maintaining trend clarity
- Periodic returns derived similarly to other ratios, with decimal conversion of target for precise excess/shortfall computations
- Cumulative above-target excesses summed for gains, below-target shortfalls for losses, via explicit loop over historical series
- Raw ratio as gains divided by losses, with zero-loss default to neutral rather than infinity, avoiding misleading perfect-period artifacts
- Smoothed output revealing distributional health—ratios above 1 favor gains, higher values signal skewed positives ideal for tail-risk hedging
- Asset-specific computations highlighting asymmetry, where fat positive tails in crypto assets can elevate omegas despite high total volatility
📈 Rate of Change Parameters
- Period length for percentage momentum measurement, shorter for reactive trend detection, longer for sustained direction confirmation
- Built-in ROC function application to source prices, yielding unbounded percentage shifts—positive for uptrends, negative for downtrends
- Zero default for missing data, treating data gaps as neutral momentum to avoid biasing composite scores
- Complementary role to risk metrics, capturing raw directional strength without normalization, spotlighting acceleration phases
- Direct integration into averages, where high ROC boosts scores in momentum-favoring selections, balanced by volatility adjustments elsewhere
- Simplicity in computation enabling lightweight inclusion, with na handling ensuring seamless array pushes in scoring logic
💼 Assets Configuration
- Number of altcoins to monitor and display, scalable from focused portfolios to broad market scans for comprehensive opportunity hunting
- Top combined assets count for dedicated ranking table, adjustable to highlight elite performers without overwhelming the view
- Individual symbol inputs grouped left and right for organizational clarity, accepting crypto pairs, indices, or custom tickers
- Conditional activation based on total count, loading only selected assets to optimize data requests and calculations
- Default focus on major and mid-cap altcoins, but fully customizable for sector-specific or emerging token universes
- Prefix stripping in displays for clean ticker presentation, enhancing readability in table formats
- Array-based storage of names and scores post-calculation, facilitating sorting, medians, and iterative population
- Integration with security requests for daily closes, ensuring uniform timeframe data across diverse exchanges
🎨 Table Style
- Background color with transparency for semi-opaque overlays, blending professional aesthetics with chart visibility
- Border color for frame delineation, providing subtle separation without distracting from metric focus
- Consistent application across main, median, and top tables, maintaining visual coherence in multi-panel layouts
- Frame width and color for structural emphasis, using dark tones to evoke institutional-grade presentation
- Color functions for score backgrounds—green for above-median outperformance, red for underperformance, gray for invalids
- Emoji integration for intuitive cues—rockets for strong assets, down arrows for laggards, enhancing at-a-glance scanning
📡 Data Fetching and Returns Calculation
- Benchmark close retrieval conditional on alpha or beta needs, using daily timeframe for consistent periodicity
- Parallel asset close fetches via security calls, defaulting to na for inactive symbols to prevent errors
- Returns function standardizing one-period ROC for daily percentage changes, zero-filling na for continuity
- Benchmark returns computed similarly, serving as regression baseline for relative metrics
- Na propagation to individual asset returns, ensuring downstream calculations skip invalid data gracefully
- Daily resolution enforcement across all fetches, aligning with annualization assumptions in ratios
- Efficient conditional logic minimizing API calls, scalable to full 33-asset loads without performance degradation
📈 Alpha Calculation
- Function guarding against na inputs, returning na for insufficient data to flag unreliable estimates
- Mean asset and benchmark returns via SMA over lookback, establishing central tendencies
- Covariance as product mean minus means product, capturing joint variability
- Benchmark variance similarly, ensuring positive denominator for beta
- Beta as cov/var ratio, zero-default for flat benchmarks to avoid divisions
- Alpha as asset mean minus beta times benchmark mean, isolating idiosyncratic performance
- Zero fallback for na alphas, treating computation failures as neutral in composites
- Per-asset execution only when enabled, feeding into scoring arrays for holistic aggregation
📉 Beta Calculation
- Identical input guards and mean computations as alpha, leveraging shared regression framework
- Covariance and variance derivations mirroring alpha prep, focusing solely on slope coefficient
- Beta output as sensitivity measure, with zero handling for degenerate cases
- Na-to-zero conversion for seamless array integration, avoiding score distortions
- Toggle-based activation per asset, allowing isolated volatility analysis without excess return overhead
- Conceptual role in diversification—low betas signal hedges, high ones amplify market bets
- Lookback sensitivity trade-off: short for tactical betas, long for structural exposures
⚡ Sharpe Ratio Calculation
- Source na guard returning na, preserving data integrity
- Daily returns via change over prior source, avoiding log approximations for arithmetic consistency
- Period SMA for mean reward, stdev for total risk dispersion
- Raw daily ratio with zero-stdev neutral default, preventing infinities
- Nz-EMA smoothing to dampen variability, weighting recent ratios heavily
- Sqrt(365) annualization for yearly comparability, assuming i.i.d. returns
- Zero na fallback, distinguishing errors from flat performance
- Asset-parallel computations, ranking efficiency where high Sharpes indicate optimal risk pricing
🎯 Sortino Ratio Calculation
- Na source guard, with annualization factor predefined for scaling
- Periodic returns and per-period risk-free derivation for threshold alignment
- Effective period min with bar count, enabling progressive buildup
- Loop-summed downside squares only for positive deviations (underperformance), averaged and sqrt-ed
- Excess mean over downside dev, scaled annually, zero-dev neutral
- Nz-EMA smoothing for stability, focusing on loss aversion
- Zero na output, emphasizing downside protection in crypto's crash-prone nature
- Longer periods favored for sparse downside events, enhancing estimate reliability
🔄 Omega Ratio Calculation
- Na guard with periodic returns and decimal target setup
- Loop over period accumulating above-target excesses vs. below shortfalls
- Raw ratio as gains/losses, zero-loss neutral to conservatism
- Nz-EMA smoothing, defaulting raw na to zero for continuity
- Distributional insight: >1 favors assets with skewed positives, <1 warns of loss dominance
- Target flexibility—zero for absolute, positive for relative hurdles
- Per-asset loops ensuring full history scan, capturing crypto's lottery-like tails
📈 Rate of Change Calculation
- Simple ta.roc application over period, percentage momentum direct from prices
- Na-to-zero for gaps, neutral in momentum absence
- Unbounded output allowing extreme trend magnitudes, unlike bounded oscillators
- Toggle integration boosting composites in trending selections
- Short-period reactivity for entry timing, complementing ratio stability
🎯 Combined Score Calculation
- Selected metrics count via incremental ifs, normalizing averages
- Last-bar loop over assets, building per-asset score arrays
- Switch-retrieved metric values, na-filtered pushes with valid count tracking
- Average only over valid scores, handling partial data gracefully
- Var assignment to per-asset combined vars, persisting for table use
- Equal-weighting assumption, treating metrics as complementary signals
- Na results when no valids, flagging data-deficient assets
- Holistic aggregation simplifying multi-metric overload into rankable scores
📊 Table Display Functions
- Background color getter: green above median, red below, gray invalid
- Emoji selector: rocket for outperformers, down for underperformers, blank invalid
- Row/column math for three-column layout, maximizing space efficiency
- Prefix-stripped asset names for compact display
- Rounded three-decimal scores or N/A, centered alignment
- Header branding centered, dark background for prominence
- Median table compact right-side, gray neutral for reference
- Top table left-side descending sort via indices array, limited rows
📋 Table Preparation
- Var arrays for names and scores, last-bar conditional pushes
- Conditional per-asset adds based on num_assets, avoiding over-allocation
- Median via array.median, central tendency for relative gauging
- Sort indices descending for top ranking, min with size for bounds
- String concatenation for alerts, newline-separated asset-score pairs
- Once-per-bar alert freq, compiling only non-na for actionable output
- Barstate.islast gating all prep/display, preventing historical repaints
✅ Key Takeaways
- Modular metrics enable tailored risk-return portfolios, from alpha hunts to downside shields
- Composite scores distill complexity into actionable rankings, median-anchored for relativity
- Benchmark-relative analysis uncovers crypto alphas amid market noise
- Table triad—main matrix, median ref, top highlights—delivers scannable insights
- Alerts and custom assets support automated monitoring in dynamic altcoin spaces
- Smoothing and lookbacks balance reactivity with stability for versatile timeframes
- Equal-metric averaging assumes balance, customizable via toggles for bias
סקריפט מוגן
סקריפט זה פורסם כמקור סגור. עם זאת, אתה יכול להשתמש בו באופן חופשי וללא כל הגבלה - למד עוד כאן.
כתב ויתור
המידע והפרסומים אינם אמורים להיות, ואינם מהווים, עצות פיננסיות, השקעות, מסחר או סוגים אחרים של עצות או המלצות שסופקו או מאושרים על ידי TradingView. קרא עוד בתנאים וההגבלות.
סקריפט מוגן
סקריפט זה פורסם כמקור סגור. עם זאת, אתה יכול להשתמש בו באופן חופשי וללא כל הגבלה - למד עוד כאן.
כתב ויתור
המידע והפרסומים אינם אמורים להיות, ואינם מהווים, עצות פיננסיות, השקעות, מסחר או סוגים אחרים של עצות או המלצות שסופקו או מאושרים על ידי TradingView. קרא עוד בתנאים וההגבלות.