OPEN-SOURCE SCRIPT
מעודכן Bionic -- Expected Weekly Levels (Public)
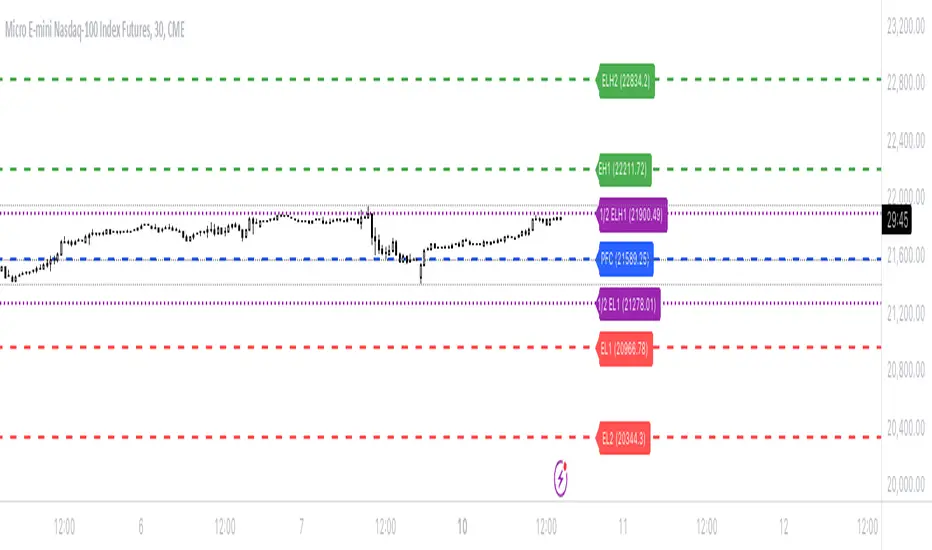
This script will draw lines for Expected Weekly Levels based upon Previous Friday Close, Implied Volatility (EOD Friday), and the square root of Days to Expire (always 7) / 365.
Script will draw 2 high and low levels:
*1st levels are 1 standard deviation from the Previous Friday Close.
* 2nd levels are 2 standard deviation from the Previous Friday Close.
There are also a 1/2 Low and 1/2 Low 1st level. These are 1/2 a standard deviation and act more as a point of interest level. 1/2 levels have 34% probability.
Configurations:
* All lines styles are individually configurable
* All lines can individually be turned on/off
* Text for all lines can be changed
* Global config allows for the
* Lines to show the price on the label
* Lines to have text in the label
* Hide or show all labels
* Lines offset from price is configurable
* Label size is configurable
הערות שחרור
* Added individual Implied Volatility inputs for Calls/Longs and Puts/Short* IV may be different between Calls and Puts based upon overall market sentiment
* Allows greater precision and flexibility for the end user
* The same values can be used in both input if desired.
הערות שחרור
Updated calculation from 365 days to 252 days. Industry standard when calculated values is 252 (the number of trading days in a year) and NOT 365 (number of calendar days in a year).
Also updated the default input for the Previous Friday close to be 0.0.
הערות שחרור
* Made days available for trading configurable. Deafult is 365 days (total days in calendar year) and other options commonly used is 252 days (number of trading days in a calendar year).
++++ User now has ability to choose number of days for calcualtion.
+ Changed default line from Dashed to Solid
הערות שחרור
Updated script to include 3 standard deviations, i.e. a 3rd Level low & high. הערות שחרור
Fixed bug with 3rd level deviation calculationסקריפט קוד פתוח
ברוח האמיתית של TradingView, יוצר הסקריפט הזה הפך אותו לקוד פתוח, כך שסוחרים יוכלו לעיין בו ולאמת את פעולתו. כל הכבוד למחבר! אמנם ניתן להשתמש בו בחינם, אך זכור כי פרסום חוזר של הקוד כפוף ל־כללי הבית שלנו.
כתב ויתור
המידע והפרסומים אינם מיועדים להיות, ואינם מהווים, ייעוץ או המלצה פיננסית, השקעתית, מסחרית או מכל סוג אחר המסופקת או מאושרת על ידי TradingView. קרא עוד ב־תנאי השימוש.
סקריפט קוד פתוח
ברוח האמיתית של TradingView, יוצר הסקריפט הזה הפך אותו לקוד פתוח, כך שסוחרים יוכלו לעיין בו ולאמת את פעולתו. כל הכבוד למחבר! אמנם ניתן להשתמש בו בחינם, אך זכור כי פרסום חוזר של הקוד כפוף ל־כללי הבית שלנו.
כתב ויתור
המידע והפרסומים אינם מיועדים להיות, ואינם מהווים, ייעוץ או המלצה פיננסית, השקעתית, מסחרית או מכל סוג אחר המסופקת או מאושרת על ידי TradingView. קרא עוד ב־תנאי השימוש.