OPEN-SOURCE SCRIPT
Upvol and Downvol
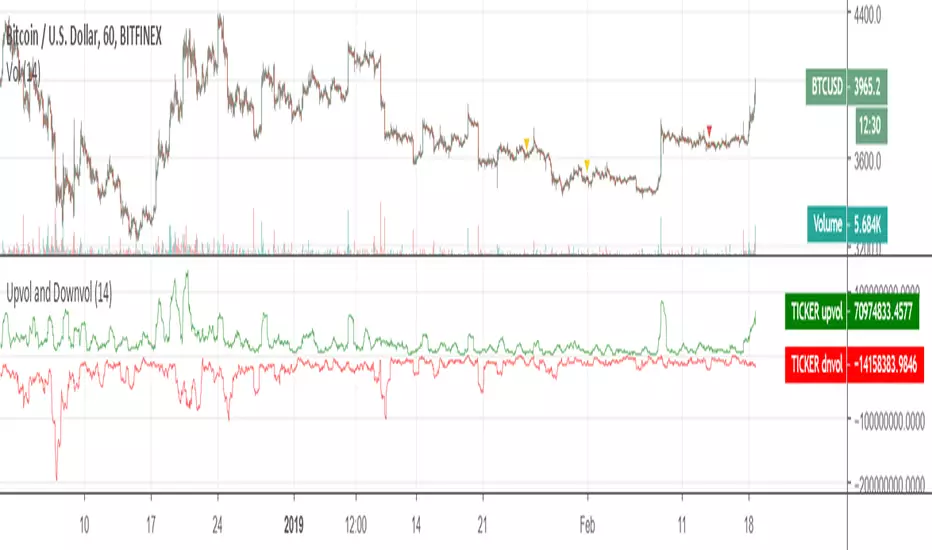
Upvolume and downvolume, calculated according to the MFI (Money Flow) formula, and shown separately.
The indicator has options for also showing NYSE upvolume and downvolume or ES1! (S&P500 upvolume/downvolume) along with the main ticker data, so you can compare them.
The chart can be analyzed by drawing trend lines, and can be surprisingly accurate.
~
The indicator has options for also showing NYSE upvolume and downvolume or ES1! (S&P500 upvolume/downvolume) along with the main ticker data, so you can compare them.
The chart can be analyzed by drawing trend lines, and can be surprisingly accurate.
~
סקריפט קוד פתוח
ברוח האמיתית של TradingView, יוצר הסקריפט הזה הפך אותו לקוד פתוח, כך שסוחרים יוכלו לעיין בו ולאמת את פעולתו. כל הכבוד למחבר! אמנם ניתן להשתמש בו בחינם, אך זכור כי פרסום חוזר של הקוד כפוף ל־כללי הבית שלנו.
כתב ויתור
המידע והפרסומים אינם מיועדים להיות, ואינם מהווים, ייעוץ או המלצה פיננסית, השקעתית, מסחרית או מכל סוג אחר המסופקת או מאושרת על ידי TradingView. קרא עוד ב־תנאי השימוש.