OPEN-SOURCE SCRIPT
מעודכן Buyer vs Seller Control
BUYER vs SELLER CONTROL INDICATOR
Identify market dominance and potential trend shifts with wick analysis
What This Indicator Measures:
This indicator analyzes who controls the market by measuring the battle between buyers and sellers on each candle:
What's Plotted:
How to Read the Signals:
Trading Applications:
Key Features:
Pro Tip: Use this with your favorite trend or momentum indicators for confluence. Strong buyer/seller control often precedes significant price moves!
Pine Script®
Identify market dominance and potential trend shifts with wick analysis
What This Indicator Measures:
This indicator analyzes who controls the market by measuring the battle between buyers and sellers on each candle:
- Buyer Control: How far the closing price is above the candle's low (bottom wick strength)
- Seller Control: How far the closing price is below the candle's high (top wick strength)
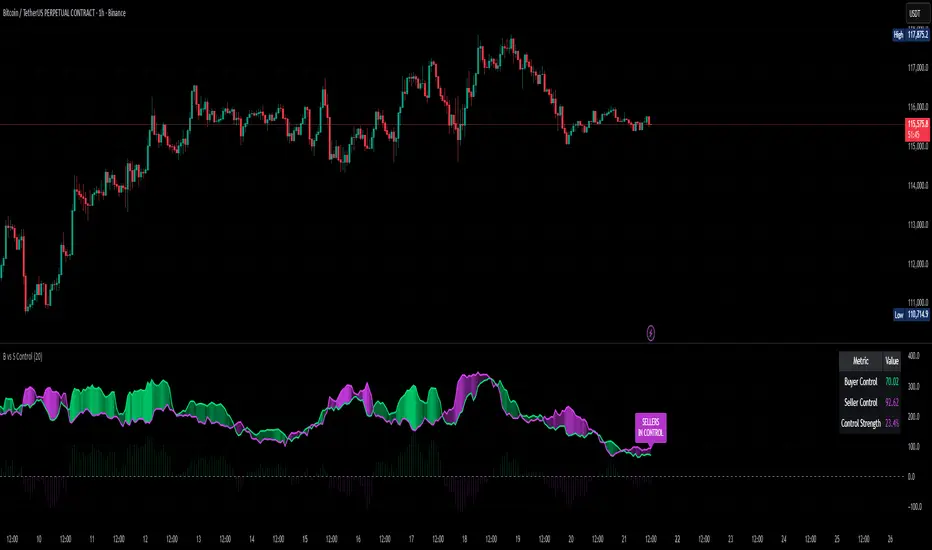
What's Plotted:
- Lime Line: 20-period moving average of buyer control
- Fuchsia Line: 20-period moving average of seller control
- Dynamic Fill: Area between lines - color shows who's winning
- Histogram: Shows the difference between buyer and seller control
- Control Label: Text showing current market dominance
- Info Table: Real-time values and control strength percentage
How to Read the Signals:
🟢 LIME FILL = BUYERS IN CONTROL
When the lime line is above fuchsia, buyers are dominating. The brighter the fill, the stronger their control.
🔴 FUCHSIA FILL = SELLERS IN CONTROL
When the fuchsia line is above lime, sellers are dominating. The brighter the fill, the stronger their control.
Trading Applications:
- Trend Confirmation: Strong buyer control confirms uptrends, strong seller control confirms downtrends
- Reversal Signals: Watch for control shifts - when lines cross, momentum may be changing
- Entry Timing: Enter long when buyer control strengthens, short when seller control strengthens
- Market Structure: Persistent control by one side suggests strong directional bias
Key Features:
- Works on any timeframe
- Customizable moving average period (default: 20)
- Optional info table display
- Dynamic transparency shows control strength
- Clean visual design for both dark and light themes
Pro Tip: Use this with your favorite trend or momentum indicators for confluence. Strong buyer/seller control often precedes significant price moves!
// Based on wick analysis and moving averages
// Green = Buyers dominating market
// Red = Sellers dominating market
// Fill intensity = Control strength
הערות שחרור
- Fix label cumulation bug
הערות שחרור
- Support Volume Based Chart Display
סקריפט קוד פתוח
ברוח TradingView אמיתית, היוצר של הסקריפט הזה הפך אותו לקוד פתוח, כך שסוחרים יכולים לבדוק ולאמת את הפונקציונליות שלו. כל הכבוד למחבר! למרות שאתה יכול להשתמש בו בחינם, זכור שפרסום מחדש של הקוד כפוף לכללי הבית שלנו.
Get access to our indicators at: huntergatherers.tech
כתב ויתור
המידע והפרסומים אינם אמורים להיות, ואינם מהווים, עצות פיננסיות, השקעות, מסחר או סוגים אחרים של עצות או המלצות שסופקו או מאושרים על ידי TradingView. קרא עוד בתנאים וההגבלות.