OPEN-SOURCE SCRIPT
Horizontal Grid from Base Price
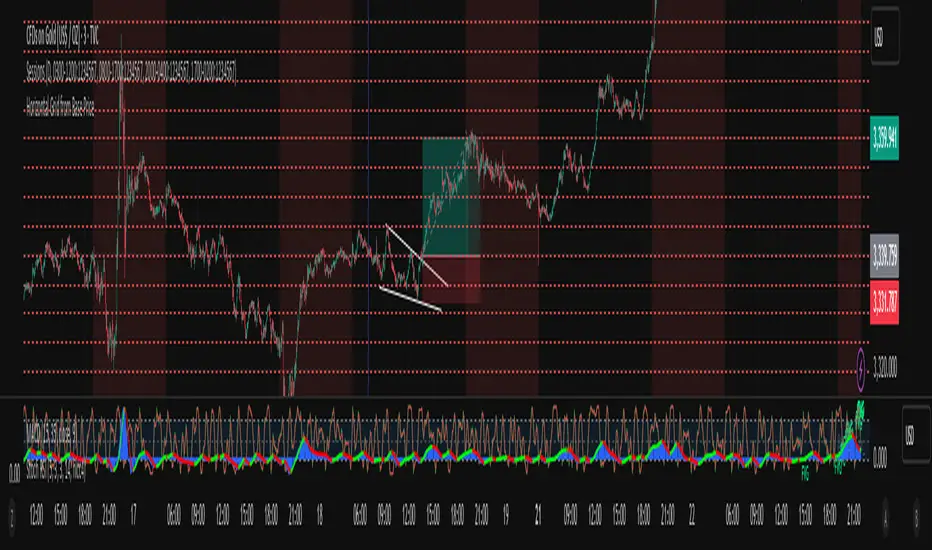
Support & Resistance Indicator function
This inductor is designed to analyze the "resistance line" according to the principle of mother fish technique, with the main purpose of:
• Measure the price swing cycle (Price Swing Cycle)
• analyze the standings of a candle to catch the tempo of the trade
• Used as a decision sponsor in conjunction with Price Action and key zones.
⸻
🛠️ Main features
1. Create Automatic Resistance Boundary
• Based on the open price level of the Day (Initial Session Open) bar.
• It's the main reference point for building a price framework.
2. Set the distance around the resistance line.
• like 100 dots/200 dots/custom
• Provides systematic price tracking (Cycle).
3. Number of lines can be set.
• For example, show 3 lines or more of the top-bottom lines as needed.
4. Customize the color and style of the line.
• The line color can be changed, the line will be in dotted line format according to the user's style.
• Day/night support (Dark/Light Theme)
5. Support for use in conjunction with mother fish techniques.
• Use the line as a base to observe whether the "candle stand above or below the line".
• It is used to help see the behavior of "standing", "loosing", or "flow" of prices on the defensive/resistance line.
6. The default is available immediately.
• The default is based on the current Day bar opening price.
• Round distance, e.g. 200 points, top and bottom, with 3 levels of performance
סקריפט קוד פתוח
ברוח האמיתית של TradingView, יוצר הסקריפט הזה הפך אותו לקוד פתוח, כך שסוחרים יוכלו לעיין בו ולאמת את פעולתו. כל הכבוד למחבר! אמנם ניתן להשתמש בו בחינם, אך זכור כי פרסום חוזר של הקוד כפוף ל־כללי הבית שלנו.
כתב ויתור
המידע והפרסומים אינם מיועדים להיות, ואינם מהווים, ייעוץ או המלצה פיננסית, השקעתית, מסחרית או מכל סוג אחר המסופקת או מאושרת על ידי TradingView. קרא עוד ב־תנאי השימוש.