PROTECTED SOURCE SCRIPT
Triple EMA + RSI candles
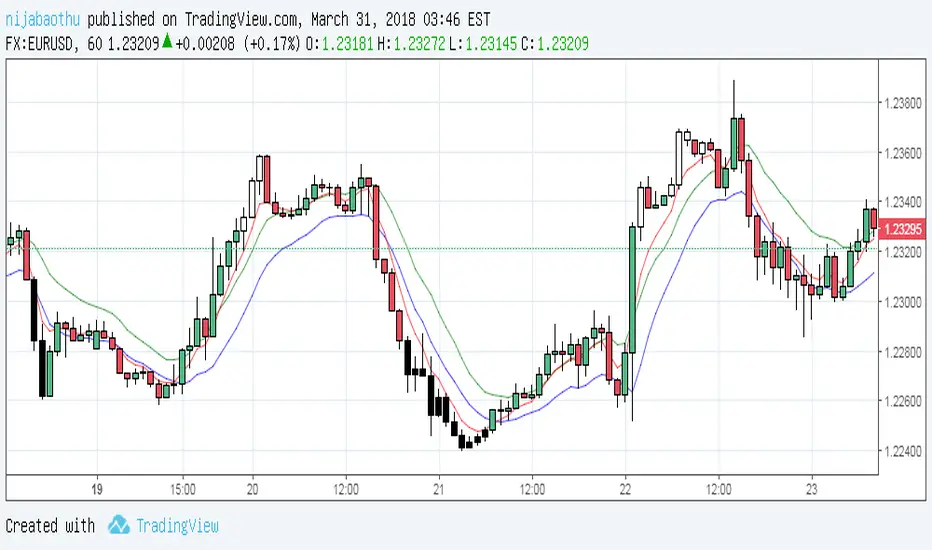
Using EMA5 ( Exponential Moving Average ) as the main trend of price, the intersection with EMA10 will signal the point of entry (go long, go short) reasonable. At this point, I pushed the EMA10 at high price to sell sooner and at low price to buy early. More specific:
- When the red line crosses the blue line, the signal is the Buy.
- When the red line cut the green line, the signal is Sell.
Efficient with short trading tactics.
Notes: Combined with pinbar signs and practal indicators will yield better results.
This is a new update with specific signals. Clearly, when the red line cut down the green line with a white candle, you had a sell signal for a few candles after. At the back side,...
סקריפט מוגן
סקריפט זה פורסם כמקור סגור. עם זאת, תוכל להשתמש בו בחופשיות וללא כל מגבלות – למד עוד כאן
כתב ויתור
המידע והפרסומים אינם מיועדים להיות, ואינם מהווים, ייעוץ או המלצה פיננסית, השקעתית, מסחרית או מכל סוג אחר המסופקת או מאושרת על ידי TradingView. קרא עוד ב־תנאי השימוש.
סקריפט מוגן
סקריפט זה פורסם כמקור סגור. עם זאת, תוכל להשתמש בו בחופשיות וללא כל מגבלות – למד עוד כאן
כתב ויתור
המידע והפרסומים אינם מיועדים להיות, ואינם מהווים, ייעוץ או המלצה פיננסית, השקעתית, מסחרית או מכל סוג אחר המסופקת או מאושרת על ידי TradingView. קרא עוד ב־תנאי השימוש.