OPEN-SOURCE SCRIPT
Multiple MA (techsound088)
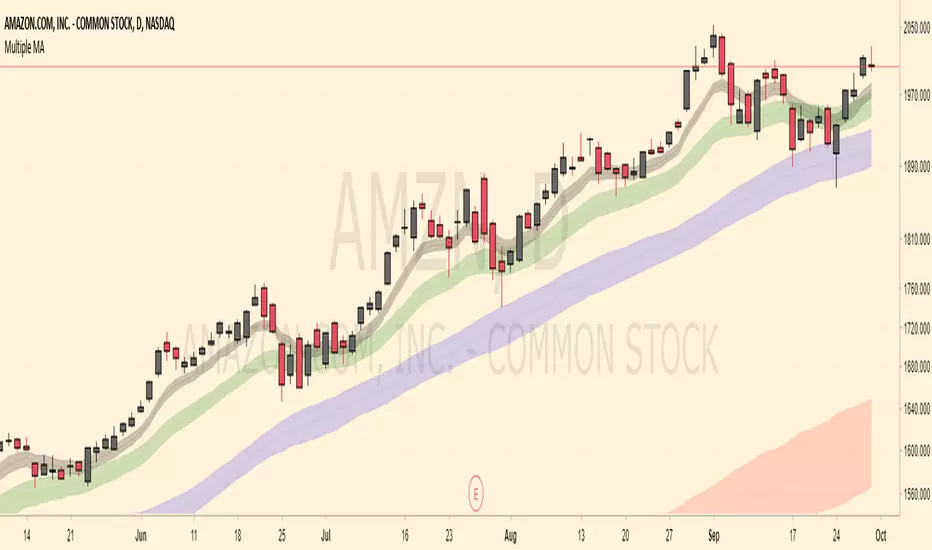
Common moving addresses often act as support and resistance levels. This script will incorporate four (2 exponential and 2 simple ) moving averages. The default are lengths of 8, 20, 50, and 200. These are adjustable. Many of us are aware that these areas often tend to be supply / demands zones. We are also aware that movement around these areas can fluctuate greatly so I've included ATR-based bands around the moving averages hoping to visualize these moving averages in a less rigid and more realistic way. Feel free to modify this script as you please. Constructive feedback is always appreciated.
סקריפט קוד פתוח
ברוח האמיתית של TradingView, יוצר הסקריפט הזה הפך אותו לקוד פתוח, כך שסוחרים יוכלו לעיין בו ולאמת את פעולתו. כל הכבוד למחבר! אמנם ניתן להשתמש בו בחינם, אך זכור כי פרסום חוזר של הקוד כפוף ל־כללי הבית שלנו.
כתב ויתור
המידע והפרסומים אינם מיועדים להיות, ואינם מהווים, ייעוץ או המלצה פיננסית, השקעתית, מסחרית או מכל סוג אחר המסופקת או מאושרת על ידי TradingView. קרא עוד ב־תנאי השימוש.