OPEN-SOURCE SCRIPT
Rob RSI Stoch MACD Combo Alert
//Created by Robert Nance on 5/28/16. Additional credit to vdubus.
//This was a special request from rich15stan. It combines my original RSI Stoch extremes with vdubus’ MACD VXI.
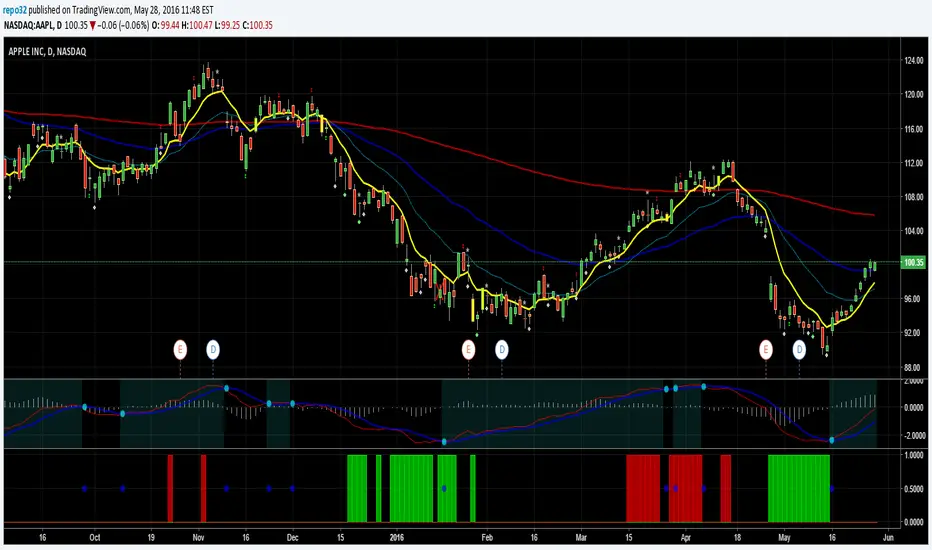
//This script will give you red or green columns as an indication for oversold/overbought,
//based upon the rsi and stochastic both being at certain levels. The default oversold is at 35.
//If Stochastic and RSI fall below 35, you will get a green column. Play with your levels to see how
//your stock reacts. It now adds the MACD crossover, plotted as a blue circle.
//This was a special request from rich15stan. It combines my original RSI Stoch extremes with vdubus’ MACD VXI.
//This script will give you red or green columns as an indication for oversold/overbought,
//based upon the rsi and stochastic both being at certain levels. The default oversold is at 35.
//If Stochastic and RSI fall below 35, you will get a green column. Play with your levels to see how
//your stock reacts. It now adds the MACD crossover, plotted as a blue circle.
סקריפט קוד פתוח
ברוח האמיתית של TradingView, יוצר הסקריפט הזה הפך אותו לקוד פתוח, כך שסוחרים יוכלו לעיין בו ולאמת את פעולתו. כל הכבוד למחבר! אמנם ניתן להשתמש בו בחינם, אך זכור כי פרסום חוזר של הקוד כפוף ל־כללי הבית שלנו.
כתב ויתור
המידע והפרסומים אינם מיועדים להיות, ואינם מהווים, ייעוץ או המלצה פיננסית, השקעתית, מסחרית או מכל סוג אחר המסופקת או מאושרת על ידי TradingView. קרא עוד ב־תנאי השימוש.