OPEN-SOURCE SCRIPT
FVE (Volatility Modified)
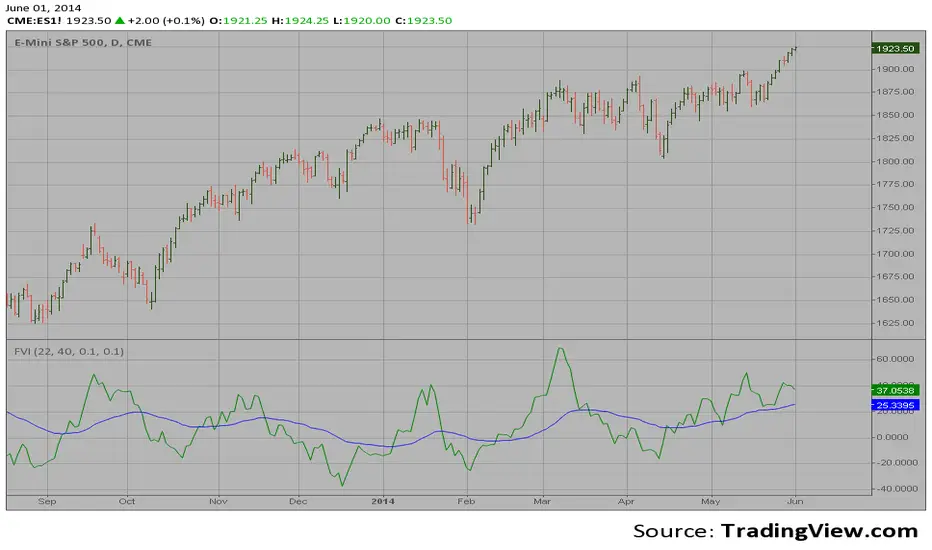
This is another version of FVE indicator that we have posted earlier
in this forum.
This version has an important enhancement to the previous one that`s
especially useful with intraday minute charts.
Due to the volatility had not been taken into account to avoid the extra
complication in the formula, the previous formula has some drawbacks:
The main drawback is that the constant cutoff coefficient will overestimate
price changes in minute charts and underestimate corresponding changes in
weekly or monthly charts.
And now the indicator uses adaptive cutoff coefficient which will adjust to
all time frames automatically.
סקריפט קוד פתוח
ברוח האמיתית של TradingView, יוצר הסקריפט הזה הפך אותו לקוד פתוח, כך שסוחרים יוכלו לעיין בו ולאמת את פעולתו. כל הכבוד למחבר! אמנם ניתן להשתמש בו בחינם, אך זכור כי פרסום חוזר של הקוד כפוף ל־כללי הבית שלנו.
פרסומים קשורים
כתב ויתור
המידע והפרסומים אינם מיועדים להיות, ואינם מהווים, ייעוץ או המלצה פיננסית, השקעתית, מסחרית או מכל סוג אחר המסופקת או מאושרת על ידי TradingView. קרא עוד ב־תנאי השימוש.