OPEN-SOURCE SCRIPT
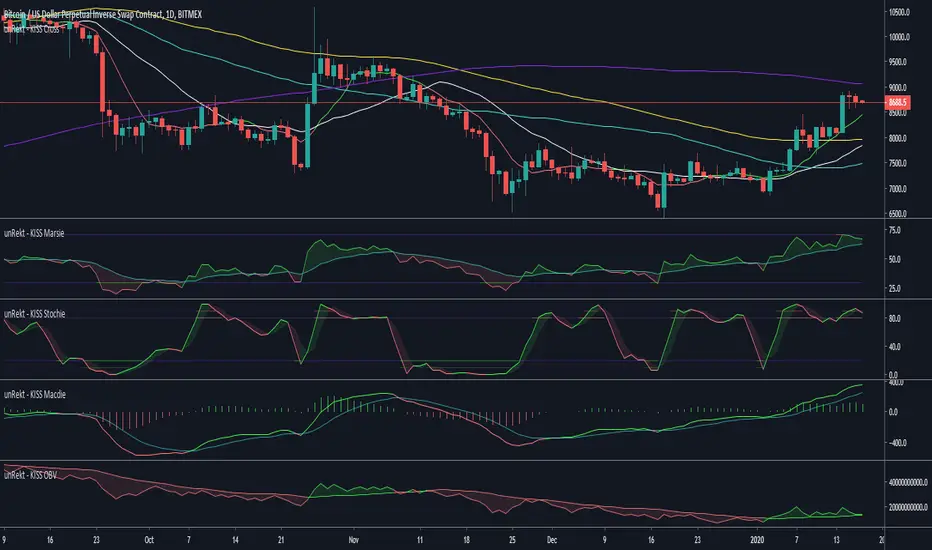
unRekt - KISS Marsie

Marsie is an EMA-RSI indicator and part of the 'keeping it simple' series that have a similar color scheme. The RSI 'Relative Strength Index' is a momentum oscillator, measuring the velocity and magnitude of directional price movements. it is measured from 0 - 100 with 30 and 70 being low "oversold" and high "overbought" conditions. It is also commonly used to determine bullish or bearish divergences.
The EMA aspect is the 'Exponential Moving Average' which has had the RSI calculation added to it and acts a signal line when the RSI crosses it for buy and sell opportunities.
The EMA aspect is the 'Exponential Moving Average' which has had the RSI calculation added to it and acts a signal line when the RSI crosses it for buy and sell opportunities.
סקריפט קוד פתוח
ברוח האמיתית של TradingView, יוצר הסקריפט הזה הפך אותו לקוד פתוח, כך שסוחרים יוכלו לעיין בו ולאמת את פעולתו. כל הכבוד למחבר! אמנם ניתן להשתמש בו בחינם, אך זכור כי פרסום חוזר של הקוד כפוף ל־כללי הבית שלנו.
כתב ויתור
המידע והפרסומים אינם מיועדים להיות, ואינם מהווים, ייעוץ או המלצה פיננסית, השקעתית, מסחרית או מכל סוג אחר המסופקת או מאושרת על ידי TradingView. קרא עוד ב־תנאי השימוש.