OPEN-SOURCE SCRIPT
Extended Support and Resistance Levels

Indicator: Extended Support and Resistance Levels
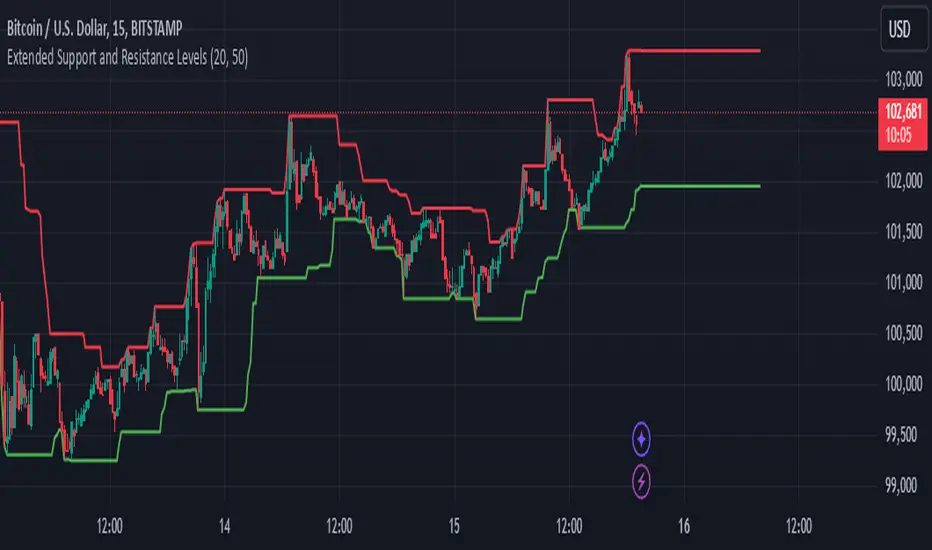
This Pine Script indicator dynamically calculates support and resistance levels based on recent price action and projects these levels into the future.
Support is determined by the lowest low over a user-defined period, while Resistance is defined by the highest high over the same period.
The indicator draws lines at the calculated support and resistance levels and extends them into the future, allowing traders to visualize potential future levels where price might react.
The extension of these lines helps in identifying areas where price may respect support or resistance in the upcoming bars.
The user can adjust the period for support/resistance calculation and the number of bars for projection, providing flexibility to adapt to different timeframes and market conditions.
This tool is ideal for traders looking to anticipate future key price levels based on historical price data, helping with decision-making on potential entry or exit points.
סקריפט קוד פתוח
ברוח האמיתית של TradingView, יוצר הסקריפט הזה הפך אותו לקוד פתוח, כך שסוחרים יוכלו לעיין בו ולאמת את פעולתו. כל הכבוד למחבר! אמנם ניתן להשתמש בו בחינם, אך זכור כי פרסום חוזר של הקוד כפוף ל־כללי הבית שלנו.
כתב ויתור
המידע והפרסומים אינם מיועדים להיות, ואינם מהווים, ייעוץ או המלצה פיננסית, השקעתית, מסחרית או מכל סוג אחר המסופקת או מאושרת על ידי TradingView. קרא עוד ב־תנאי השימוש.