OPEN-SOURCE SCRIPT
Wilder's Channel
The Wilder’s channel is a typical channel indicator made of 2 Wilder’s average from the high and low price over a “p” period, factorized by the Average True Range value over “atx” period.
Indicator from Kevin Britain library.
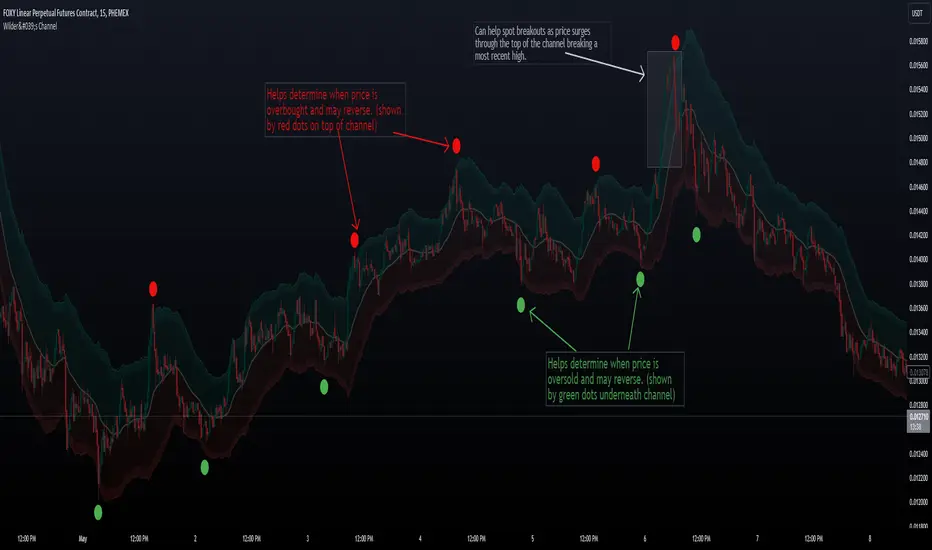
"Wilder's Channel," which is plotted on the chart overlay to assist traders in visualizing potential support and resistance levels. This script uses a combination of Wilder's Moving Average and the Average True Range (ATR) to create a channel around price movements. Here's a breakdown of how it works and its benefits:
Trend Confirmation: The channel helps confirm the current trend direction. If prices are consistently near the upper boundary, it suggests an uptrend, and vice versa for a downtrend.
Support and Resistance Levels: The Upper and Lower lines serve as dynamic support and resistance levels, which can help traders identify potential entry and exit points.
Volatility Insight: The width of the channel gives insight into market volatility. A wider channel indicates higher volatility, while a narrower channel suggests less volatility.
Trade Management: The buffer zones can be used for additional decision-making points, such as tightening stop-loss orders or preparing for potential breakouts or pullbacks.
Indicator from Kevin Britain library.
"Wilder's Channel," which is plotted on the chart overlay to assist traders in visualizing potential support and resistance levels. This script uses a combination of Wilder's Moving Average and the Average True Range (ATR) to create a channel around price movements. Here's a breakdown of how it works and its benefits:
Trend Confirmation: The channel helps confirm the current trend direction. If prices are consistently near the upper boundary, it suggests an uptrend, and vice versa for a downtrend.
Support and Resistance Levels: The Upper and Lower lines serve as dynamic support and resistance levels, which can help traders identify potential entry and exit points.
Volatility Insight: The width of the channel gives insight into market volatility. A wider channel indicates higher volatility, while a narrower channel suggests less volatility.
Trade Management: The buffer zones can be used for additional decision-making points, such as tightening stop-loss orders or preparing for potential breakouts or pullbacks.
סקריפט קוד פתוח
ברוח האמיתית של TradingView, יוצר הסקריפט הזה הפך אותו לקוד פתוח, כך שסוחרים יוכלו לעיין בו ולאמת את פעולתו. כל הכבוד למחבר! אמנם ניתן להשתמש בו בחינם, אך זכור כי פרסום חוזר של הקוד כפוף ל־כללי הבית שלנו.
כתב ויתור
המידע והפרסומים אינם מיועדים להיות, ואינם מהווים, ייעוץ או המלצה פיננסית, השקעתית, מסחרית או מכל סוג אחר המסופקת או מאושרת על ידי TradingView. קרא עוד ב־תנאי השימוש.