OPEN-SOURCE SCRIPT
Prev Day & Curr Day H/L + Opening Range (9:30, 5min)
Script Description:
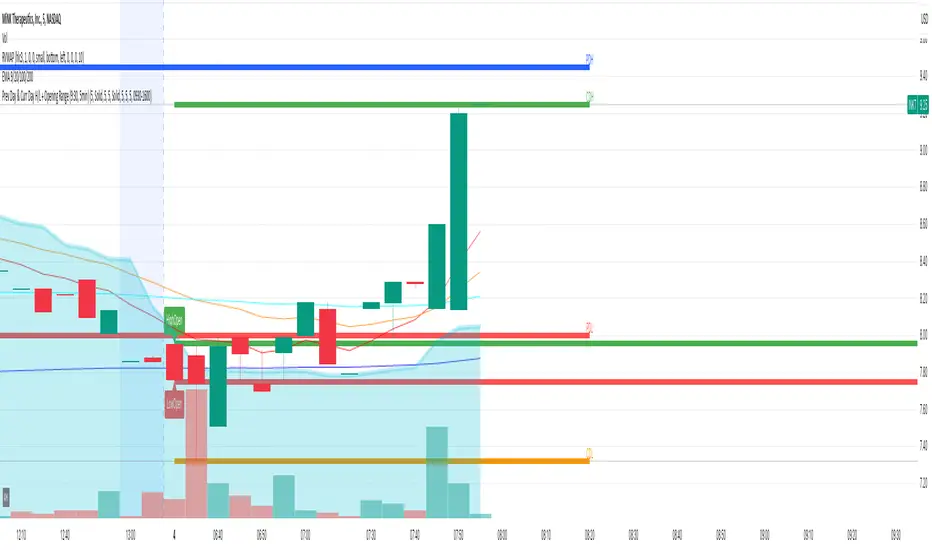
This TradingView Pine Script is designed for use on a 5‑minute chart and plots key price levels for daily trading analysis. It automatically draws:
• Previous Day High/Low Lines:
These lines mark the previous day’s regular trading hours (RTH) high and low levels, with labels (“PDH” and “PDL”) for easy identification.
• Current Day High/Low Lines:
As the trading day progresses, the script updates and displays the current day’s RTH high and low levels, labeled as “CDH” and “CDL”.
• Opening Range for 9:30 AM:
The script specifically identifies the first 5‑minute candle at 9:30 AM (using the “America/New_York” time zone) and draws two additional lines at its high and low. These lines are labeled “HighOpen” and “LowOpen” to indicate the opening range.
All lines are drawn with a width of 5 and have configurable colors, styles, and extension lengths. The script automatically resets at the start of each new day, ensuring that the plotted levels are current and relevant for daily trading decisions.
סקריפט קוד פתוח
ברוח האמיתית של TradingView, יוצר הסקריפט הזה הפך אותו לקוד פתוח, כך שסוחרים יוכלו לעיין בו ולאמת את פעולתו. כל הכבוד למחבר! אמנם ניתן להשתמש בו בחינם, אך זכור כי פרסום חוזר של הקוד כפוף ל־כללי הבית שלנו.
כתב ויתור
המידע והפרסומים אינם מיועדים להיות, ואינם מהווים, ייעוץ או המלצה פיננסית, השקעתית, מסחרית או מכל סוג אחר המסופקת או מאושרת על ידי TradingView. קרא עוד ב־תנאי השימוש.