Spartan
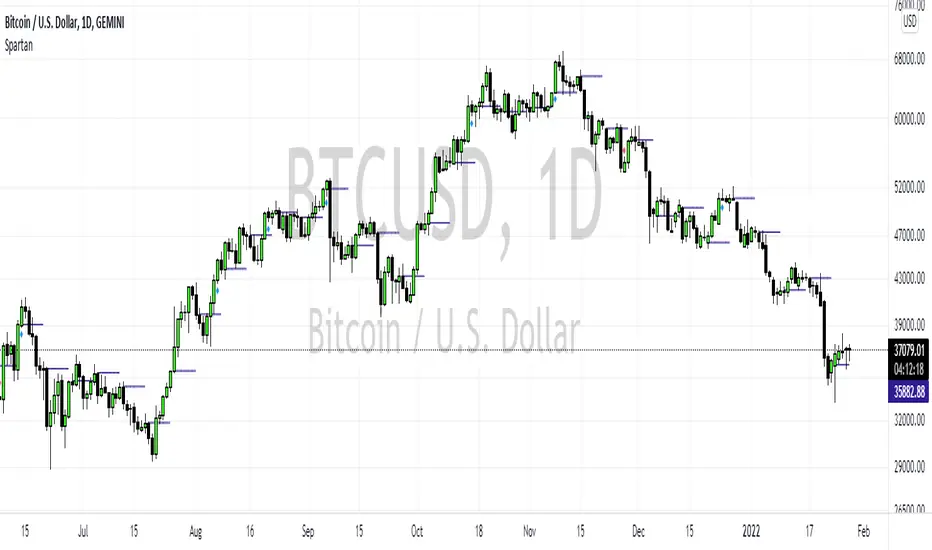
This is a momentum strategy which attempts to identify when buying pressure or selling pressure is present in the markets.
How to trade the long side:
Once a blue candle appears, enter Long on pullbacks into a blue candle for longs
Place your stop loss on the opposite side of the blue candle.
Target a previous high for longs
How to trade the short side:
Once a red candle appears, enter Short on pullbacks into a red candle for shorts
Place your stop on the opposite side of the red candle.
Target a previous low for shorts
Support and Resistance levels shown as:
- Previous Day Highs/Lows
- Previous Week Highs/Lows
- Previous Month Highs/Lows
A blue candle combined with a blue circle = High Strength Buying Pressure.
A blue candle combined with a orange circle = Medium Strength Buying Pressure.
A blue candle combined with a yellow circle = Low Strength Buying Pressure.
A red candle combined with a red circle = High Strength Selling Pressure.
A red candle combined with a orange circle = Medium Strength Selling Pressure.
A red candle combined with a yellow circle = Low Strength Selling Pressure.
סקריפט להזמנה בלבד
רק משתמשים שאושרו על ידי המחבר יכולים לגשת לסקריפט הזה. יהיה עליך לשלוח בקשת גישה ולקבל אישור לשימוש. בדרך כלל, הגישה ניתנת לאחר תשלום. למידע נוסף, עקוב אחר ההוראות של היוצר בהמשך או צור קשר עם LiquidityTracker ישירות.
TradingView לא ממליצה לשלם עבור סקריפט או להשתמש בו אלא אם כן אתה סומך לחלוטין על המחבר שלו ומבין כיצד הוא פועל. ייתכן שתוכל גם למצוא חלופות חינמיות וקוד פתוח ב-סקריפטים הקהילתיים שלנו.
הוראות המחבר
כתב ויתור
סקריפט להזמנה בלבד
רק משתמשים שאושרו על ידי המחבר יכולים לגשת לסקריפט הזה. יהיה עליך לשלוח בקשת גישה ולקבל אישור לשימוש. בדרך כלל, הגישה ניתנת לאחר תשלום. למידע נוסף, עקוב אחר ההוראות של היוצר בהמשך או צור קשר עם LiquidityTracker ישירות.
TradingView לא ממליצה לשלם עבור סקריפט או להשתמש בו אלא אם כן אתה סומך לחלוטין על המחבר שלו ומבין כיצד הוא פועל. ייתכן שתוכל גם למצוא חלופות חינמיות וקוד פתוח ב-סקריפטים הקהילתיים שלנו.