OPEN-SOURCE SCRIPT
ROBO STB Custom Weekly Candle (Fri-Thu)
Description:
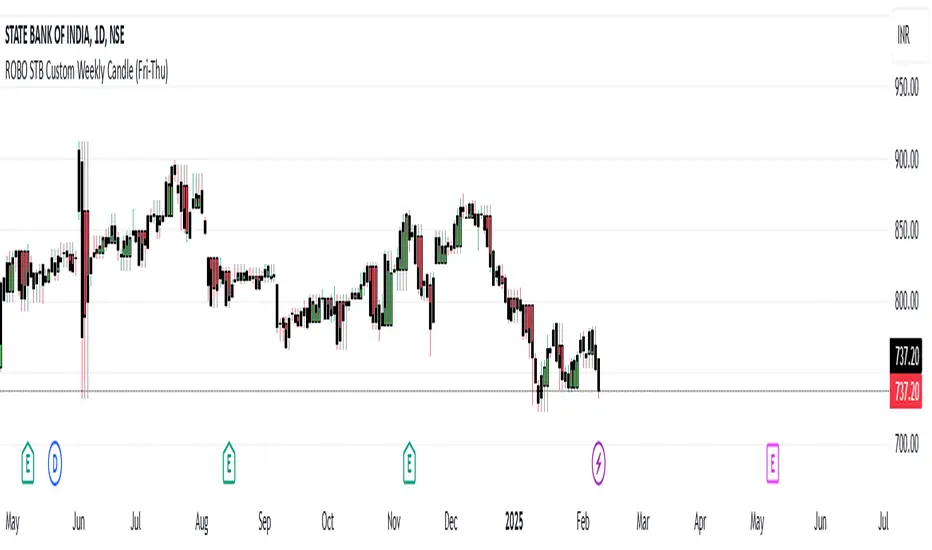
This indicator creates custom weekly candles that start on Friday and end on Thursday, instead of the standard Monday–Friday weekly structure in TradingView. It aggregates the open, high, low, and close (OHLC) values from Friday to Thursday and displays them as candlesticks on the chart.
Features:
✅ Custom weekly candles from Friday to Thursday
✅ Dynamic calculation of open, high, low, and close
✅ Works on any timeframe
✅ Helps traders analyze market structure differently
How It Works:
Identifies the custom weekly session based on Friday's start and Thursday's end.
Aggregates OHLC values within this time range.
Resets the values when a new custom week begins.
Plots the calculated weekly candles on the chart.
Use Case:
This indicator is useful for traders who prefer to analyze weekly price movements based on a non-standard start and end day, especially those focusing on forex, crypto, or commodities where trading hours differ.
Notes:
This script does not modify existing candles but overlays new custom weekly candles on the chart.
It does not repaint and updates in real-time.
If you find this useful, like and share! 🚀
סקריפט קוד פתוח
ברוח האמיתית של TradingView, יוצר הסקריפט הזה הפך אותו לקוד פתוח, כך שסוחרים יוכלו לעיין בו ולאמת את פעולתו. כל הכבוד למחבר! אמנם ניתן להשתמש בו בחינם, אך זכור כי פרסום חוזר של הקוד כפוף ל־כללי הבית שלנו.
כתב ויתור
המידע והפרסומים אינם מיועדים להיות, ואינם מהווים, ייעוץ או המלצה פיננסית, השקעתית, מסחרית או מכל סוג אחר המסופקת או מאושרת על ידי TradingView. קרא עוד ב־תנאי השימוש.