OPEN-SOURCE SCRIPT
מעודכן MCV - Meme Coin Volume [Logue]
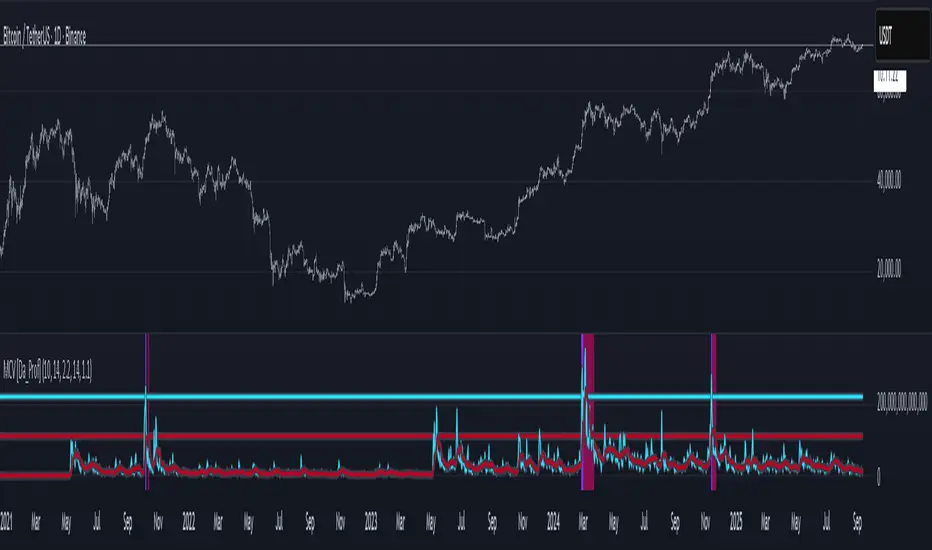
Meme Coin Volume. Investor preference for meme coin trading may signal irrational exuberance in the crypto market. If a large spike in meme coin volume is observed, a top may be near. Therefore, the volume of the most popular meme coins was added together in this indicator to help indicate potential mania phases, which may signal nearing of a top. A simple moving average of the meme coin volume also helps visualize the trend while reducing the noise. In back testing, I found a 10-day sma of the meme coin volume works well.
Meme coins were not traded heavily prior to 2020. Therefore, there is only one cycle to test at the time of initial publication. Also, the meme coin space moves fast, so more meme coins may need to be added later.
The total volume is plotted along with a moving average of the volume. For the indicator, you are able to change the raw volume trigger line, the sma trigger line, and the period (daily) of the sma to your own preferences. The raw volume or sma going above their respective trigger lines will print a different background color.
Use this indicator at your own risk. I make no claims as to its accuracy in forecasting future trend changes of Bitcoin or the crypto market.
הערות שחרור
Thanks TradingView for creating the symbol MEME.C. This indicator will now be automatically updated. I also added trigger alerts. The indicator is set to get data from MEME.C on the daily so that it can work when looking at other symbols. Some other minor additions were made. הערות שחרור
Added back in the individual largest meme coins since MEME.C was changed such that a large amount of the past data was not displayed. Now, whenever there is data for MEME.C, it overrides the individual meme coins. Also, understand that if an individual meme coin was not in existence during that date, it will not contribute to the meme coin volume. Note that this indicator only works on the daily timeframe currently.
הערות שחרור
Updated to allow the indicator to be used on multiple timeframes. The trigger lines are set for daily volume values. Therefore, they will have to be adjusted to work for other timeframes. הערות שחרור
Updated the trigger line values and made minor modifications to make the indicator display prettier. --Da_Prof
סקריפט קוד פתוח
ברוח האמיתית של TradingView, יוצר הסקריפט הזה הפך אותו לקוד פתוח, כך שסוחרים יוכלו לעיין בו ולאמת את פעולתו. כל הכבוד למחבר! אמנם ניתן להשתמש בו בחינם, אך זכור כי פרסום חוזר של הקוד כפוף ל־כללי הבית שלנו.
כתב ויתור
המידע והפרסומים אינם מיועדים להיות, ואינם מהווים, ייעוץ או המלצה פיננסית, השקעתית, מסחרית או מכל סוג אחר המסופקת או מאושרת על ידי TradingView. קרא עוד ב־תנאי השימוש.