OPEN-SOURCE SCRIPT
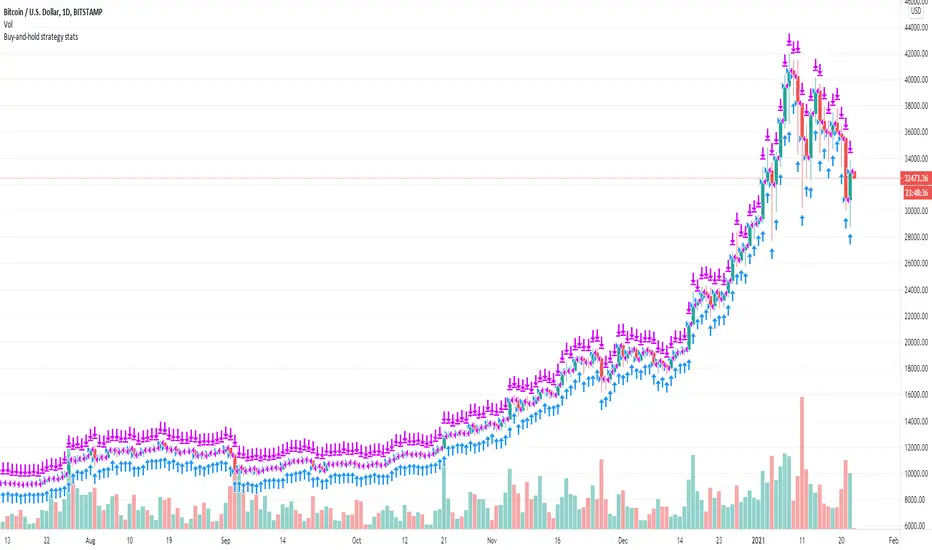
Buy-and-hold strategy stats

When you develop your own strategy you should compare its performance to the "buy-and-hold" strategy (you buy the financial instrument and you hold it long term). Ideally your strategy should perform better than the buy-and-hold strategy. While the net profit % of the buy-and-hold strategy is available under the "Performance Summary" tab of the "Strategy Tester" there are other factors that should be considered though. This is where this strategy comes in. It mimics the buy-and-hold strategy and gives you all the stats that are available for any strategy. For example, one such criteria that should be considered is the max. drawdown. Even if you strategy performs worse than the buy-and-hold strategy in terms of net profit, if the max. drawdown of your strategy is considerably lower than that of the buy-and-hold it may overall be a better strategy than the buy-and-hold as, in this scenario, it likely exposes the investor to significantly less risk.
סקריפט קוד פתוח
ברוח האמיתית של TradingView, יוצר הסקריפט הזה הפך אותו לקוד פתוח, כך שסוחרים יוכלו לעיין בו ולאמת את פעולתו. כל הכבוד למחבר! אמנם ניתן להשתמש בו בחינם, אך זכור כי פרסום חוזר של הקוד כפוף ל־כללי הבית שלנו.
Join free discord.gg/wDTkRnS or t.me/TradersForecast
כתב ויתור
המידע והפרסומים אינם מיועדים להיות, ואינם מהווים, ייעוץ או המלצה פיננסית, השקעתית, מסחרית או מכל סוג אחר המסופקת או מאושרת על ידי TradingView. קרא עוד ב־תנאי השימוש.