MM Matrix Oscillator
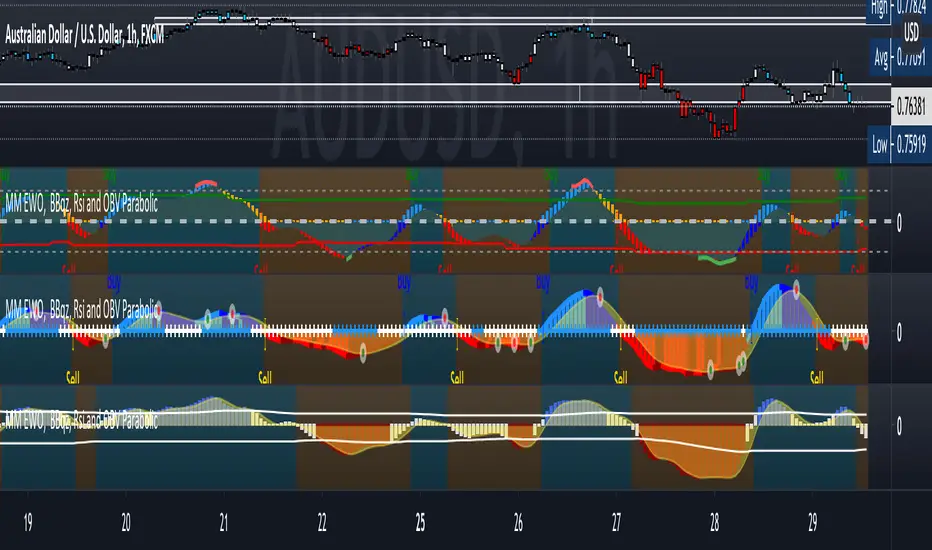
What the oscillator and histogram represent are trend candles, when the histogram is painted lime above 0 line it is buy, you will also see the buy signal below with an arrow, when the oscillator is painted red below the 0 line you will see the signal in red sell.
Dynamic Support and resistance to see possible exit points and extra confirmation on zones
You have an additional, exit buy and exit sell to perform scalping.
It has buy and sell signals alarm and also the painting of candles on the chart to see the trend. green=uptrend/red= downtrend
added "color trend and exit" in settings
red=downtrend
white=ranging
green=buy
Use link below or PM us for access you this indicator Happy Trading
Matrix
BBsquuze
and EWO all in one indicator
all of them can set buy/sell alerts.
סקריפט להזמנה בלבד
רק משתמשים שאושרו על ידי המחבר יכולים לגשת לסקריפט הזה. יהיה עליך לשלוח בקשת גישה ולקבל אישור לשימוש. בדרך כלל, הגישה ניתנת לאחר תשלום. למידע נוסף, עקוב אחר ההוראות של היוצר בהמשך או צור קשר עם MoneyMovesInvestments ישירות.
TradingView לא ממליצה לשלם עבור סקריפט או להשתמש בו אלא אם כן אתה סומך לחלוטין על המחבר שלו ומבין כיצד הוא פועל. ייתכן שתוכל גם למצוא חלופות חינמיות וקוד פתוח ב-סקריפטים הקהילתיים שלנו.
הוראות המחבר
כתב ויתור
סקריפט להזמנה בלבד
רק משתמשים שאושרו על ידי המחבר יכולים לגשת לסקריפט הזה. יהיה עליך לשלוח בקשת גישה ולקבל אישור לשימוש. בדרך כלל, הגישה ניתנת לאחר תשלום. למידע נוסף, עקוב אחר ההוראות של היוצר בהמשך או צור קשר עם MoneyMovesInvestments ישירות.
TradingView לא ממליצה לשלם עבור סקריפט או להשתמש בו אלא אם כן אתה סומך לחלוטין על המחבר שלו ומבין כיצד הוא פועל. ייתכן שתוכל גם למצוא חלופות חינמיות וקוד פתוח ב-סקריפטים הקהילתיים שלנו.