OPEN-SOURCE SCRIPT
מעודכן Double Top/Bottom - Ultimate (OS)
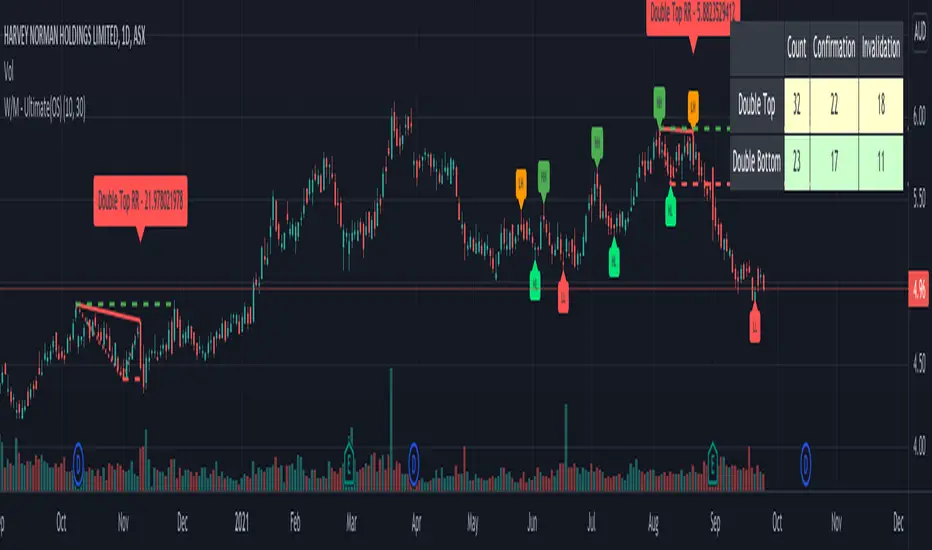
This is zigzag based double top/bottom indicator. Code is same as : Double-Top-Bottom-Ultimate
But, republishing it to make it available open source.
Double Top:
Double Bottom:
Few input options:
But, republishing it to make it available open source.
Double Top:
- Recognition - Checks on Zigzag if LH is followed by HH
- Confirmation - When low crosses under last lower pivot point on zigzag
- Invalidation - When high crosses over HH
Double Bottom:
- Recognition - Checks on Zigzag if HL is followed by LL
- Confirmation - When high crosses over last higher pivot point on zigzag
- Invalidation - When low crosses under LL
Few input options:
- Option to display risk per reward which defines how steep is the W-M triangle. This is simply the ratio of price difference between mid point to top most and bottom most points. In case of double top , downside is considered as reward and upside is considered as risk and with double bottom , downside is considered as risk and upside is considered as reward. Lower risk per reward signifies better trade.
- Option to display stats which shows number of occurances of double top and bottom and how many times price crossed confirmation point and invalidation point (which are also marked with dashed lines) Stats are color coded. Higher confirmation rates are colored in shades of green, lower confirmation rates are colored in shades of orange whereas the neutral confirmation rates are coloed in light yellow.
הערות שחרור
Added max_bars_back for resolve issue with historical bars.הערות שחרור
Fixed runtime errorסקריפט קוד פתוח
ברוח האמיתית של TradingView, יוצר הסקריפט הזה הפך אותו לקוד פתוח, כך שסוחרים יוכלו לעיין בו ולאמת את פעולתו. כל הכבוד למחבר! אמנם ניתן להשתמש בו בחינם, אך זכור כי פרסום חוזר של הקוד כפוף ל־כללי הבית שלנו.
Trial - trendoscope.io/trial
Subscribe - trendoscope.io/pricing
Blog - docs.trendoscope.io
Subscribe - trendoscope.io/pricing
Blog - docs.trendoscope.io
כתב ויתור
המידע והפרסומים אינם מיועדים להיות, ואינם מהווים, ייעוץ או המלצה פיננסית, השקעתית, מסחרית או מכל סוג אחר המסופקת או מאושרת על ידי TradingView. קרא עוד ב־תנאי השימוש.
סקריפט קוד פתוח
ברוח האמיתית של TradingView, יוצר הסקריפט הזה הפך אותו לקוד פתוח, כך שסוחרים יוכלו לעיין בו ולאמת את פעולתו. כל הכבוד למחבר! אמנם ניתן להשתמש בו בחינם, אך זכור כי פרסום חוזר של הקוד כפוף ל־כללי הבית שלנו.
Trial - trendoscope.io/trial
Subscribe - trendoscope.io/pricing
Blog - docs.trendoscope.io
Subscribe - trendoscope.io/pricing
Blog - docs.trendoscope.io
כתב ויתור
המידע והפרסומים אינם מיועדים להיות, ואינם מהווים, ייעוץ או המלצה פיננסית, השקעתית, מסחרית או מכל סוג אחר המסופקת או מאושרת על ידי TradingView. קרא עוד ב־תנאי השימוש.