OPEN-SOURCE SCRIPT
מעודכן Top and Bottom Identifier [digit23]

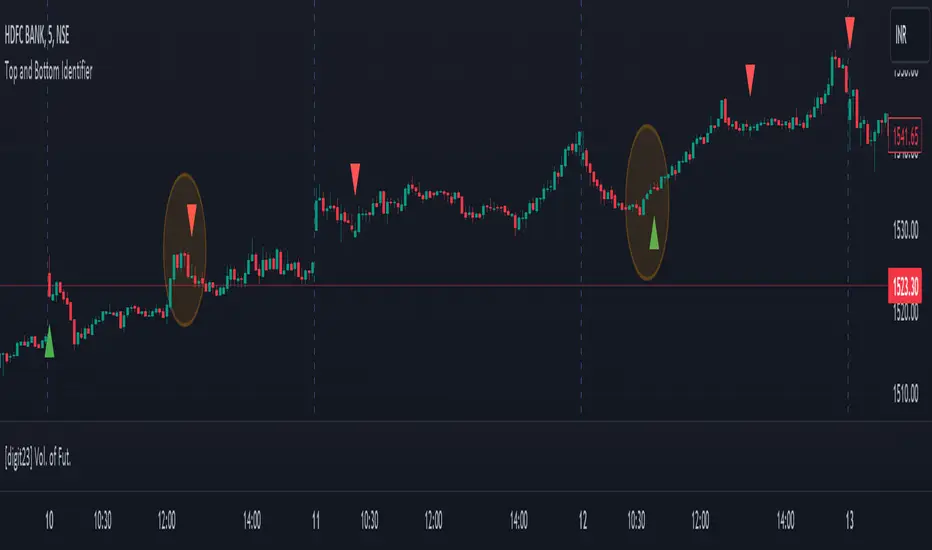
This indicator is designed to identify potential market tops and bottoms based on customizable conditions. It employs price action analysis, considering candlestick patterns, body size, and recent price history. Traders can adjust parameters like the threshold multiplier and body size multiplier to fine-tune sensitivity.
Features:
Identifies potential tops and bottoms.
Customizable threshold and body size multipliers.
Utilizes price action analysis exclusively.
User-friendly and visually represented on the chart.
Usage:
Red Triangles: Indicate potential market tops.
Green Triangles: Indicate potential market bottoms.
Parameters:
Threshold Multiplier: Adjusts sensitivity.
Body Size Multiplier: Controls the significance of candlestick body size.
Note:
This indicator is for traders preferring price action analysis to identify potential reversals. It's recommended to use alongside other technical analysis tools for comprehensive trading decisions.
Disclaimer:
Trading involves risk; thorough analysis is crucial before making decisions. This indicator is a tool for technical analysis and should be part of a broader trading strategy.
סקריפט קוד פתוח
ברוח האמיתית של TradingView, יוצר הסקריפט הזה הפך אותו לקוד פתוח, כך שסוחרים יוכלו לעיין בו ולאמת את פעולתו. כל הכבוד למחבר! אמנם ניתן להשתמש בו בחינם, אך זכור כי פרסום חוזר של הקוד כפוף ל־כללי הבית שלנו.
כתב ויתור
המידע והפרסומים אינם מיועדים להיות, ואינם מהווים, ייעוץ או המלצה פיננסית, השקעתית, מסחרית או מכל סוג אחר המסופקת או מאושרת על ידי TradingView. קרא עוד ב־תנאי השימוש.