OPEN-SOURCE SCRIPT
מעודכן VSA Signals [odnac]
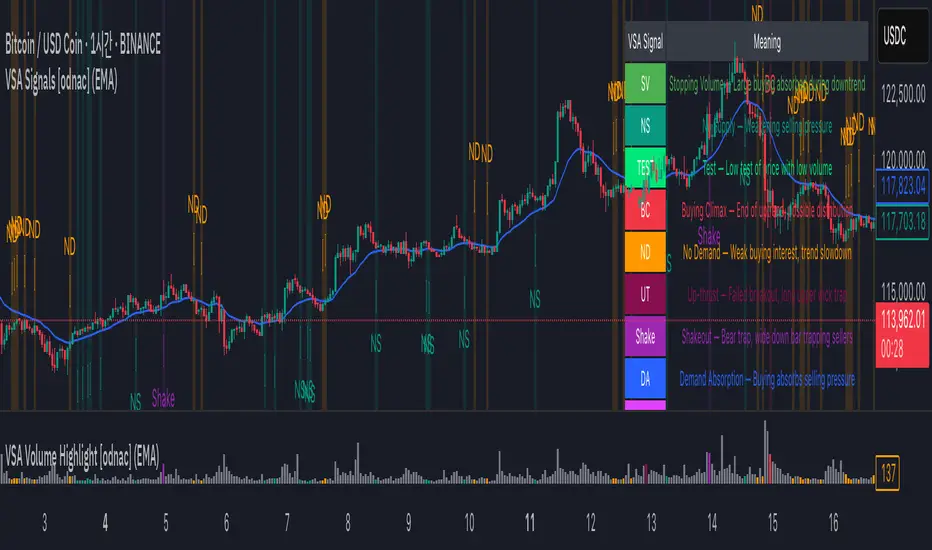
This indicator applies Volume Spread Analysis (VSA) concepts to highlight important supply and demand events directly on the chart. It automatically detects common VSA patterns using price spread, relative volume, and candle structure, with optional trend filtering for higher accuracy.
Features:
Additional Options:
This tool is designed to help traders spot professional accumulation and distribution activity and to improve trade timing by recognizing supply/demand imbalances in the market.
Features:
- Stopping Volume (SV): Signals potential end of a downtrend when heavy buying appears.
- Buying Climax (BC): Indicates exhaustion of an uptrend with heavy volume near the top.
- No Supply (NS): Weak selling pressure, often a bullish sign in an uptrend.
- No Demand (ND): Weak buying interest, often a bearish sign in a downtrend.
- Test: Low-volume test bar probing for supply.
- Up-thrust (UT): Failed breakout with long upper wick, often a bearish trap.
- Shakeout: Bear trap with high-volume wide down bar closing low.
- Demand Absorption (DA): Demand absorbing heavy selling pressure.
- Supply Absorption (SA): Supply absorbing heavy buying pressure.
Additional Options:
- Background highlights for detected signals.
- Configurable moving average (SMA, EMA, WMA, VWMA) as a trend filter.
- Adjustable multipliers for volume and spread sensitivity.
- Legend table for quick reference of signals and meanings.
- Alerts available for all signals.
This tool is designed to help traders spot professional accumulation and distribution activity and to improve trade timing by recognizing supply/demand imbalances in the market.
הערות שחרור
- Added options to customize table position (top_left, top_right, bottom_left, bottom_right).
- Added options to adjust table font size (tiny, small, normal, large, huge).
- Minor improvements and optimizations to table display.
סקריפט קוד פתוח
ברוח האמיתית של TradingView, יוצר הסקריפט הזה הפך אותו לקוד פתוח, כך שסוחרים יוכלו לעיין בו ולאמת את פעולתו. כל הכבוד למחבר! אמנם ניתן להשתמש בו בחינם, אך זכור כי פרסום חוזר של הקוד כפוף ל־כללי הבית שלנו.
כתב ויתור
המידע והפרסומים אינם מיועדים להיות, ואינם מהווים, ייעוץ או המלצה פיננסית, השקעתית, מסחרית או מכל סוג אחר המסופקת או מאושרת על ידי TradingView. קרא עוד ב־תנאי השימוש.