OPEN-SOURCE SCRIPT
PROWIN STUDY ALTCOIN INDEX

PROWIN STUDY ALTCOIN INDEX
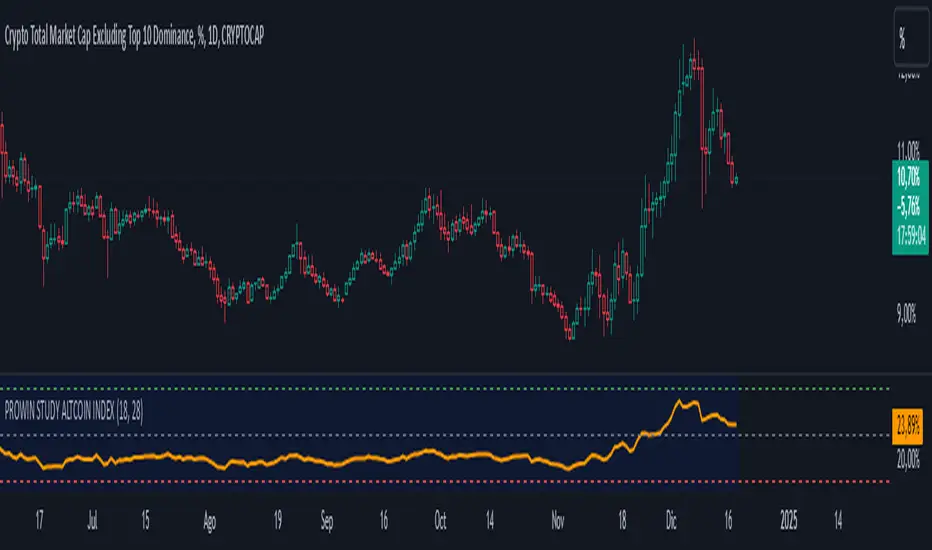
This indicator tracks the performance of key altcoin dominance indices (BTC.D, ETH.D, USDT.D, USDC.D, and DAI.D) by analyzing their closing prices. It calculates an Exponential Moving Average (EMA) to highlight the overall trend of the altcoin market. Key horizontal levels representing support (limit up), resistance (limit down), and a central line are drawn to help identify potential price action zones. This indicator is designed for analysis on the others.d asset in a daily timeframe, providing insights into market movements and altcoin dominance shifts.
This indicator tracks the performance of key altcoin dominance indices (BTC.D, ETH.D, USDT.D, USDC.D, and DAI.D) by analyzing their closing prices. It calculates an Exponential Moving Average (EMA) to highlight the overall trend of the altcoin market. Key horizontal levels representing support (limit up), resistance (limit down), and a central line are drawn to help identify potential price action zones. This indicator is designed for analysis on the others.d asset in a daily timeframe, providing insights into market movements and altcoin dominance shifts.
סקריפט קוד פתוח
ברוח האמיתית של TradingView, יוצר הסקריפט הזה הפך אותו לקוד פתוח, כך שסוחרים יוכלו לעיין בו ולאמת את פעולתו. כל הכבוד למחבר! אמנם ניתן להשתמש בו בחינם, אך זכור כי פרסום חוזר של הקוד כפוף ל־כללי הבית שלנו.
כתב ויתור
המידע והפרסומים אינם מיועדים להיות, ואינם מהווים, ייעוץ או המלצה פיננסית, השקעתית, מסחרית או מכל סוג אחר המסופקת או מאושרת על ידי TradingView. קרא עוד ב־תנאי השימוש.