OPEN-SOURCE SCRIPT
Normalized Market Indicators
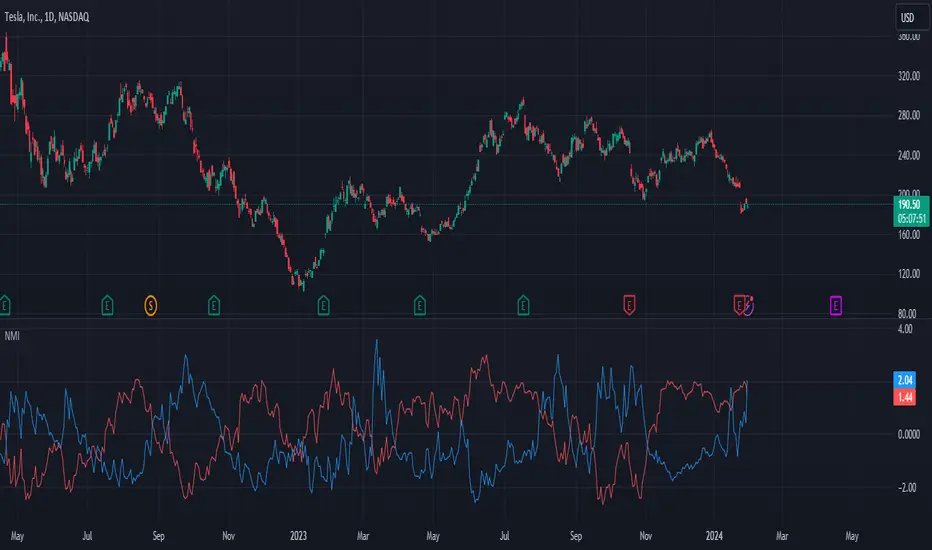
Explanation of the Code:
Data Retrieval: The script retrieves the closing prices of the S&P 500 (sp500) and VIX (vix).
Normalization: The script normalizes these values using a simple z-score normalization (subtracting the 50-period simple moving average and dividing by the 50-period standard deviation). This makes the scales of the two datasets more comparable.
Plotting with Secondary Axis: The normalized values of the S&P 500 and VIX are plotted on the same chart. They will share the same y-axis scale as the main chart (e.g. Netflix, GOLD, Forex).
Points to Note:
Normalization Method: The method of normalization (z-score in this case) is a choice and can be adjusted based on your needs. The idea is to bring the data to a comparable scale.
Timeframe and Symbol Codes: Ensure the timeframe and symbol codes are appropriate for your data source and trading strategy.
Overlaying on Price Chart: Since these values are normalized and plotted on a seperate chart, they won't directly correspond to the price levels of the main chart (e.g. Netflix, GOLD, Forex).
סקריפט קוד פתוח
ברוח האמיתית של TradingView, יוצר הסקריפט הזה הפך אותו לקוד פתוח, כך שסוחרים יוכלו לעיין בו ולאמת את פעולתו. כל הכבוד למחבר! אמנם ניתן להשתמש בו בחינם, אך זכור כי פרסום חוזר של הקוד כפוף ל־כללי הבית שלנו.
כתב ויתור
המידע והפרסומים אינם מיועדים להיות, ואינם מהווים, ייעוץ או המלצה פיננסית, השקעתית, מסחרית או מכל סוג אחר המסופקת או מאושרת על ידי TradingView. קרא עוד ב־תנאי השימוש.