OPEN-SOURCE SCRIPT
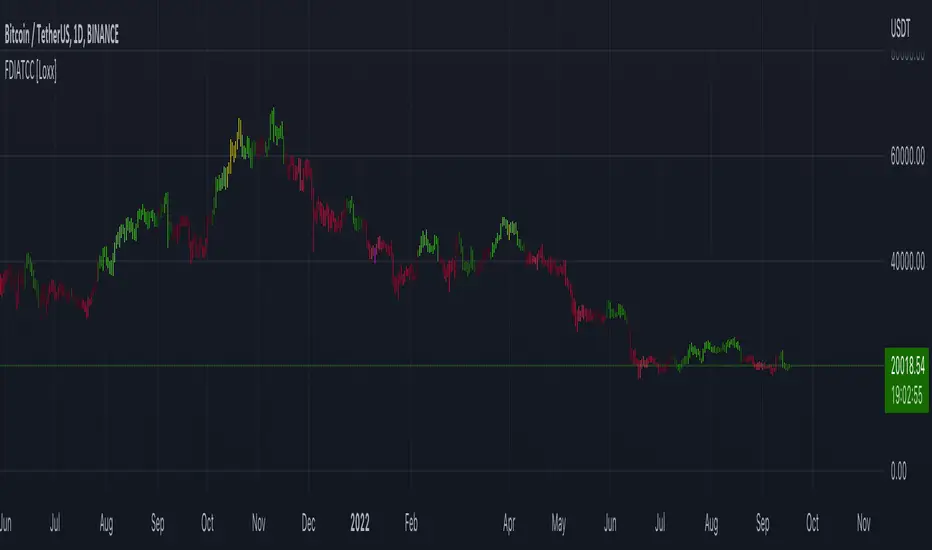
Fractal-Dimension-Index-Adaptive Trend Cipher Candles [Loxx]

Fractal-Dimension-Index-Adaptive Trend Cipher Candles [Loxx] is a candle coloring indicator that shows both trend and trend exhaustion using Fractal Dimension Index Adaptivity. To do this, we first calculate the dynamic period outputs from the FDI algorithm and then we injection those period inputs into a correlation function that correlates price input price to the candle index. The closer the correlation is to 1, the lighter the green color until the color turns yellow, sometimes, indicating upward price exhaustion. The closer the correlation is to -1, the lighter the red color until it reaches Fuchsia color indicating downward price exhaustion. Green means uptrend, red means downtrend, yellow means reversal from uptrend to downtrend, fuchsia means reversal from downtrend to uptrend.
What is the Fractal Dimension Index?
The goal of the fractal dimension index is to determine whether the market is trending or in a trading range. It does not measure the direction of the trend. A value less than 1.5 indicates that the price series is persistent or that the market is trending. Lower values of the FDI indicate a stronger trend. A value greater than 1.5 indicates that the market is in a trading range and is acting in a more random fashion.
Included
Related indicators:
Adaptive Trend Cipher loxx]
![Adaptive Trend Cipher loxx]](https://s3.tradingview.com/a/a7062wqw_mid.png)
CFB-Adaptive Trend Cipher Candles [Loxx]
![CFB-Adaptive Trend Cipher Candles [Loxx]](https://s3.tradingview.com/j/jfhV0TV0_mid.png)
Dynamic Zones Polychromatic Momentum Candles [Loxx]
![Dynamic Zones Polychromatic Momentum Candles [Loxx]](https://s3.tradingview.com/f/FobvhfB1_mid.png)
RSI Precision Trend Candles [Loxx]
![RSI Precision Trend Candles [Loxx]](https://s3.tradingview.com/t/t5ZeeiHO_mid.png)
What is the Fractal Dimension Index?
The goal of the fractal dimension index is to determine whether the market is trending or in a trading range. It does not measure the direction of the trend. A value less than 1.5 indicates that the price series is persistent or that the market is trending. Lower values of the FDI indicate a stronger trend. A value greater than 1.5 indicates that the market is in a trading range and is acting in a more random fashion.
Included
- Loxx's Expanded Source Types
Related indicators:
Adaptive Trend Cipher loxx]
![Adaptive Trend Cipher loxx]](https://s3.tradingview.com/a/a7062wqw_mid.png)
CFB-Adaptive Trend Cipher Candles [Loxx]
![CFB-Adaptive Trend Cipher Candles [Loxx]](https://s3.tradingview.com/j/jfhV0TV0_mid.png)
Dynamic Zones Polychromatic Momentum Candles [Loxx]
![Dynamic Zones Polychromatic Momentum Candles [Loxx]](https://s3.tradingview.com/f/FobvhfB1_mid.png)
RSI Precision Trend Candles [Loxx]
![RSI Precision Trend Candles [Loxx]](https://s3.tradingview.com/t/t5ZeeiHO_mid.png)
סקריפט קוד פתוח
ברוח האמיתית של TradingView, יוצר הסקריפט הזה הפך אותו לקוד פתוח, כך שסוחרים יוכלו לעיין בו ולאמת את פעולתו. כל הכבוד למחבר! אמנם ניתן להשתמש בו בחינם, אך זכור כי פרסום חוזר של הקוד כפוף ל־כללי הבית שלנו.
Public Telegram Group, t.me/algxtrading_public
VIP Membership Info: patreon.com/algxtrading/membership
VIP Membership Info: patreon.com/algxtrading/membership
כתב ויתור
המידע והפרסומים אינם מיועדים להיות, ואינם מהווים, ייעוץ או המלצה פיננסית, השקעתית, מסחרית או מכל סוג אחר המסופקת או מאושרת על ידי TradingView. קרא עוד ב־תנאי השימוש.