OPEN-SOURCE SCRIPT
Candilator RSI [AstrideUnicorn]
OVERVIEW
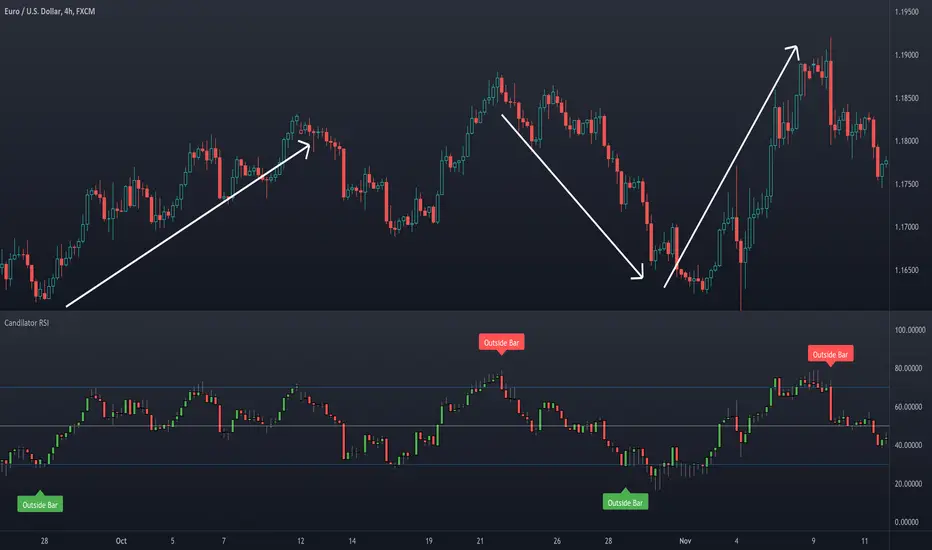
The name Candilator comes from blending the words "candlestick" and "oscillator". And as the name suggests, this indicator is a good old RSI plotted as a candlestick chart. To produce a candlestick chart, Candilator RSI calculates four RSI's based on the open, high, low, and close time series. It also has a candlestick patterns detection feature.
HOW TO USE
You can use Candilator RSI as a normal RSI to analyze momentum, detect overbought and oversold markets, and find the oscillator's divergences with the price. You can also get creative and apply all sorts of technical analysis to the RSI candlestick chart, including candlestick patterns analysis.
Candilator RSI can automatically scan the price for some candlestick patterns in the overbought and oversold zones. This feature can help detect price reversals early.
SETTINGS
The indicator settings are divided into two groups: Main Settings and Pattern Detection. In the Main Settings, you can find standard RSI settings. In the Pattern Detection part, you can turn on and off the automatic search for a particular candlestick pattern.
סקריפט קוד פתוח
ברוח האמיתית של TradingView, יוצר הסקריפט הזה הפך אותו לקוד פתוח, כך שסוחרים יוכלו לעיין בו ולאמת את פעולתו. כל הכבוד למחבר! אמנם ניתן להשתמש בו בחינם, אך זכור כי פרסום חוזר של הקוד כפוף ל־כללי הבית שלנו.
Our premium trading indicators: unicorn.trading
Join our Discord community: dsc.gg/unicom
Join our Discord community: dsc.gg/unicom
כתב ויתור
המידע והפרסומים אינם מיועדים להיות, ואינם מהווים, ייעוץ או המלצה פיננסית, השקעתית, מסחרית או מכל סוג אחר המסופקת או מאושרת על ידי TradingView. קרא עוד ב־תנאי השימוש.