OPEN-SOURCE SCRIPT
מעודכן Greer Value Yields Line

📈 Greer Value Yields Line – Valuation Signal Without the Clutter
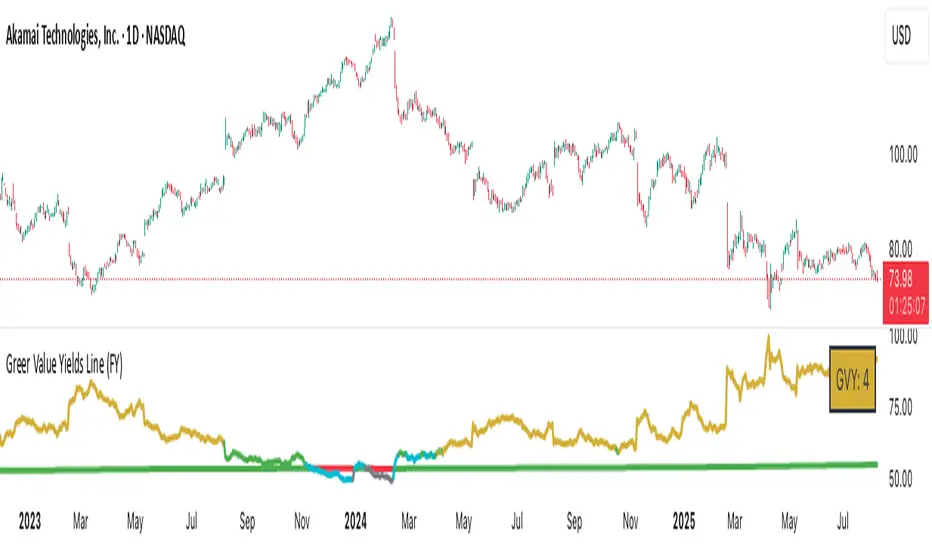
Part of the Greer Financial Toolkit, this streamlined indicator tracks four valuation-based yield metrics and presents them clearly via the Data Window, GVY Score badge, and an optional Yield Table:
Earnings Yield (EPS ÷ Price)
FCF Yield (Free Cash Flow ÷ Price)
Revenue Yield (Revenue per Share ÷ Price)
Book Value Yield (Book Value per Share ÷ Price)
✅ Each yield is compared against its historical average
✅ A point is scored for each metric above average (0–4 total)
✅ Color-coded GVY Score badge highlights valuation strength
✅ Yield trend-lines Totals (TVAVG & TVPCT) help assess direction
✅ Clean layout: no chart clutter – just actionable insights
🧮 GVY Score Color Coding (0–4):
⬜ 0 = None (White)
⬜ 1 = Weak (Gray)
🟦 2 = Neutral (Aqua)
🟩 3 = Strong (Green)
🟨 4 = Gold Exceptional (All metrics above average)
Total Value Average Line Color Coding:
🟥 Red – Average trending down
🟩 Green – Average trending up
Ideal for long-term investors focused on fundamental valuation, not short-term noise.
Enable the table and badge for a compact yield dashboard — or keep it minimal with just the Data Window and trend-lines.
הערות שחרור
Adjusted Gold hue to a richer, more authentic tone—reduced the overly yellow tint that could be misread as a caution signal.הערות שחרור
*Fixed the Chart.Adjusted Gold hue to a richer, more authentic tone—reduced the overly yellow tint that could be misread as a caution signal.
Added the ability to toggle between Fiscal Year (FY) and Fiscal Quarter (FQ) views—now you can analyze quarterly data as well as annual metrics for greater flexibility.
סקריפט קוד פתוח
ברוח האמיתית של TradingView, יוצר הסקריפט הזה הפך אותו לקוד פתוח, כך שסוחרים יוכלו לעיין בו ולאמת את פעולתו. כל הכבוד למחבר! אמנם ניתן להשתמש בו בחינם, אך זכור כי פרסום חוזר של הקוד כפוף ל־כללי הבית שלנו.
כתב ויתור
המידע והפרסומים אינם מיועדים להיות, ואינם מהווים, ייעוץ או המלצה פיננסית, השקעתית, מסחרית או מכל סוג אחר המסופקת או מאושרת על ידי TradingView. קרא עוד ב־תנאי השימוש.