OPEN-SOURCE SCRIPT
מעודכן Multi Time Frame EMA Signal & Resistance
Full code and description: github.com/samgozman/MTF-EMA-Signal-and-Resistance
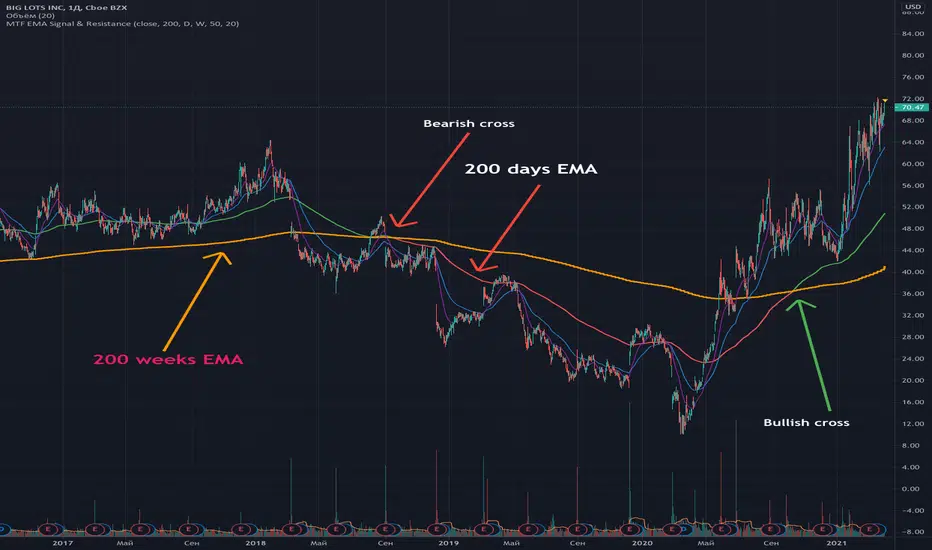
The idea of this script is quite simple. Imagine that you have a 200-day EMA and its support or resistance line is the 200-week EMA.
Then if EMA 200 1D > EMA 200 1W then the trend is bullish.
That is, EMA 200 1D is the signal line, and EMA 200 1W is the resistance.
Of course, you can independently set the time interval for the signal line and resistance, as well as the number of periods.
In addition to setting time intervals and period lengths, you can optionally enable the display of additional class EMAs.
You can also set the timeframe for the signal line equal to the current time period.
הערות שחרור
Chart updateסקריפט קוד פתוח
ברוח האמיתית של TradingView, יוצר הסקריפט הזה הפך אותו לקוד פתוח, כך שסוחרים יוכלו לעיין בו ולאמת את פעולתו. כל הכבוד למחבר! אמנם ניתן להשתמש בו בחינם, אך זכור כי פרסום חוזר של הקוד כפוף ל־כללי הבית שלנו.
כתב ויתור
המידע והפרסומים אינם מיועדים להיות, ואינם מהווים, ייעוץ או המלצה פיננסית, השקעתית, מסחרית או מכל סוג אחר המסופקת או מאושרת על ידי TradingView. קרא עוד ב־תנאי השימוש.
סקריפט קוד פתוח
ברוח האמיתית של TradingView, יוצר הסקריפט הזה הפך אותו לקוד פתוח, כך שסוחרים יוכלו לעיין בו ולאמת את פעולתו. כל הכבוד למחבר! אמנם ניתן להשתמש בו בחינם, אך זכור כי פרסום חוזר של הקוד כפוף ל־כללי הבית שלנו.
כתב ויתור
המידע והפרסומים אינם מיועדים להיות, ואינם מהווים, ייעוץ או המלצה פיננסית, השקעתית, מסחרית או מכל סוג אחר המסופקת או מאושרת על ידי TradingView. קרא עוד ב־תנאי השימוש.