OPEN-SOURCE SCRIPT
[RickAtw] S1 Support and resistance
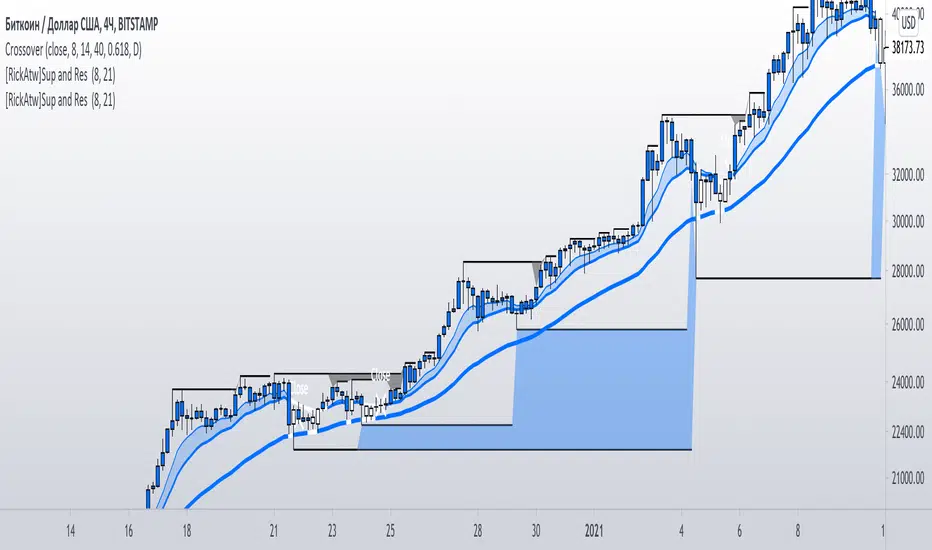
This indicator helps to identify the current support and resistance in the market.
Function
Shows at which points the correction appears and at which points there is resistance
Key Signal
buy ---> If a blue zone forms
sell --->If a black zone forms
Remarks
This helps you determine the approximate support and resistance area.
Since we cannot look into the future, it does not inform you about the exact entries, but it shows who is dominating the market at the moment.
Readme
In real life, I am a professional investor. And I check each of my indicators on my portfolio and how effective it is. I will not post a non-working method. The main thing is to wait for the beginning of trends and make money!
I would be grateful if you subscribe ❤️
סקריפט קוד פתוח
ברוח האמיתית של TradingView, יוצר הסקריפט הזה הפך אותו לקוד פתוח, כך שסוחרים יוכלו לעיין בו ולאמת את פעולתו. כל הכבוד למחבר! אמנם ניתן להשתמש בו בחינם, אך זכור כי פרסום חוזר של הקוד כפוף ל־כללי הבית שלנו.
כתב ויתור
המידע והפרסומים אינם מיועדים להיות, ואינם מהווים, ייעוץ או המלצה פיננסית, השקעתית, מסחרית או מכל סוג אחר המסופקת או מאושרת על ידי TradingView. קרא עוד ב־תנאי השימוש.