OPEN-SOURCE SCRIPT
GSD by MATA
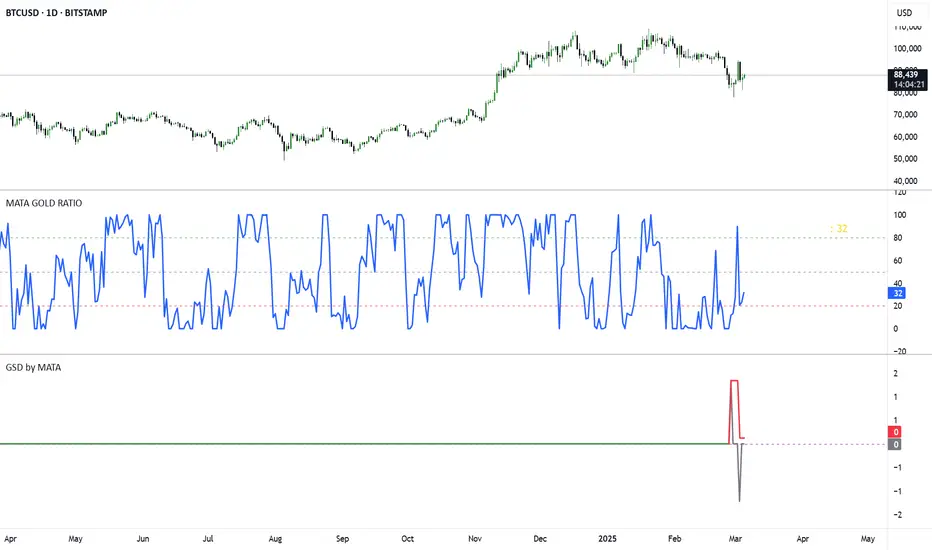
GSD by MATA - Gold-Sensitive Divergence Indicator
Overview:
The GSD by MATA indicator is designed to analyze the inverse correlation between an instrument’s price movement and gold (XAU/USD) over a selected time period. It helps traders identify whether the instrument tends to move in the opposite direction of gold, providing insights into potential hedging opportunities or market sentiment shifts.
How It Works:
User-Defined Time Period:
The user selects a time frame for comparison (1 Day, 1 Week, 1 Month, 3 Months, 6 Months, or 12 Months).
The indicator calculates the percentage change in both the instrument’s price and gold price over this period.
Inverse Movement Calculation:
If gold increases and the instrument decreases, the indicator registers a negative inverse change.
If gold decreases and the instrument increases, the indicator registers a positive inverse change.
If both move in the same direction, no inverse movement is recorded.
Cumulative Tracking:
The Reverse Change line shows the instant inverse movement.
The Total Change line accumulates the inverse movements over time, helping traders spot trends and long-term divergences.
How to Use:
A rising Total Change line (green) suggests that the instrument frequently moves in the opposite direction of gold, indicating a possible hedge effect.
A falling Total Change line (red) means the instrument has been moving in sync with gold rather than diverging.
The 0 reference line helps identify whether the cumulative effect is positive or negative over time.
סקריפט קוד פתוח
ברוח האמיתית של TradingView, יוצר הסקריפט הזה הפך אותו לקוד פתוח, כך שסוחרים יוכלו לעיין בו ולאמת את פעולתו. כל הכבוד למחבר! אמנם ניתן להשתמש בו בחינם, אך זכור כי פרסום חוזר של הקוד כפוף ל־כללי הבית שלנו.
כתב ויתור
המידע והפרסומים אינם מיועדים להיות, ואינם מהווים, ייעוץ או המלצה פיננסית, השקעתית, מסחרית או מכל סוג אחר המסופקת או מאושרת על ידי TradingView. קרא עוד ב־תנאי השימוש.