OPEN-SOURCE SCRIPT
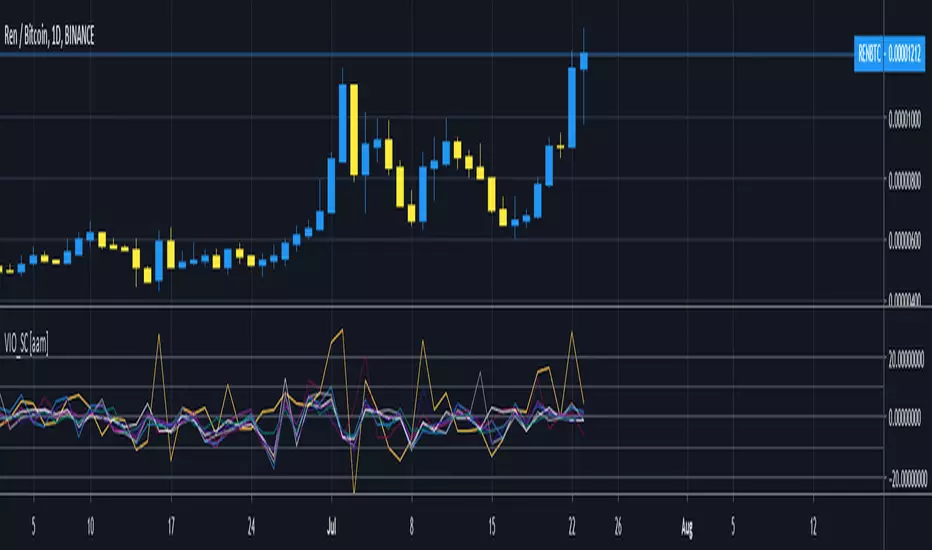
Volatility Index Oscillator SmallCap [aamonkey]

There are two versions of this indicator (Large and Small Cap).
Both work exactly the same the only difference are the default coins selected (and this version compares only 9 coins in total instead of 10).
What does this indicator do?
- can be used on any timeframe
- plots the percentage change of the candles of the selected timeframe of 8 SmallCap coins (Default: REN, LOOM, MANA, ENJ , KNC, ZRX, BNT, REP)
- +1 line for the chart you are currently on (Default: red line)
Why use this indicator:
- compare selected coins to the SmallCap coins in terms of volatility
- see correlations in price movements
- see which coin outperforms the others
- find coins that are behind
Settings:
- pairs, exchanges, and colors changeable
- always write the pairs and exchanges in caps!
סקריפט קוד פתוח
ברוח האמיתית של TradingView, יוצר הסקריפט הזה הפך אותו לקוד פתוח, כך שסוחרים יוכלו לעיין בו ולאמת את פעולתו. כל הכבוד למחבר! אמנם ניתן להשתמש בו בחינם, אך זכור כי פרסום חוזר של הקוד כפוף ל־כללי הבית שלנו.
כתב ויתור
המידע והפרסומים אינם מיועדים להיות, ואינם מהווים, ייעוץ או המלצה פיננסית, השקעתית, מסחרית או מכל סוג אחר המסופקת או מאושרת על ידי TradingView. קרא עוד ב־תנאי השימוש.