OPEN-SOURCE SCRIPT
RSI with plot lines
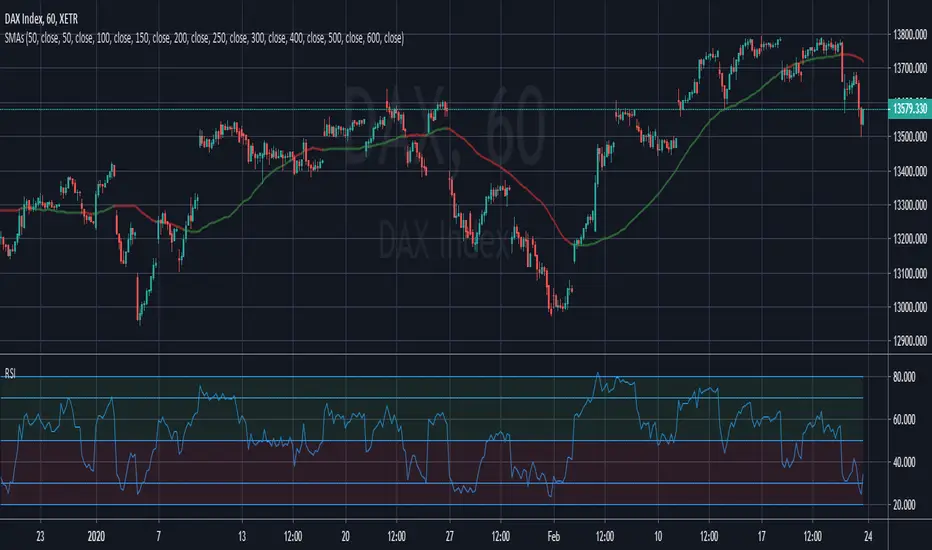
This is my first script it's pretty simple, the plots are as follows:
80 = Sell
70 = Pending sell
50 = Pullback / Retest
30 = Pending buy
20 = Buy
I would add the text to the plot lines but not sure how, if anyone has away. Please comment and I'll update.
80 = Sell
70 = Pending sell
50 = Pullback / Retest
30 = Pending buy
20 = Buy
I would add the text to the plot lines but not sure how, if anyone has away. Please comment and I'll update.
סקריפט קוד פתוח
ברוח האמיתית של TradingView, יוצר הסקריפט הזה הפך אותו לקוד פתוח, כך שסוחרים יוכלו לעיין בו ולאמת את פעולתו. כל הכבוד למחבר! אמנם ניתן להשתמש בו בחינם, אך זכור כי פרסום חוזר של הקוד כפוף ל־כללי הבית שלנו.
כתב ויתור
המידע והפרסומים אינם מיועדים להיות, ואינם מהווים, ייעוץ או המלצה פיננסית, השקעתית, מסחרית או מכל סוג אחר המסופקת או מאושרת על ידי TradingView. קרא עוד ב־תנאי השימוש.