PROTECTED SOURCE SCRIPT
Range Plot

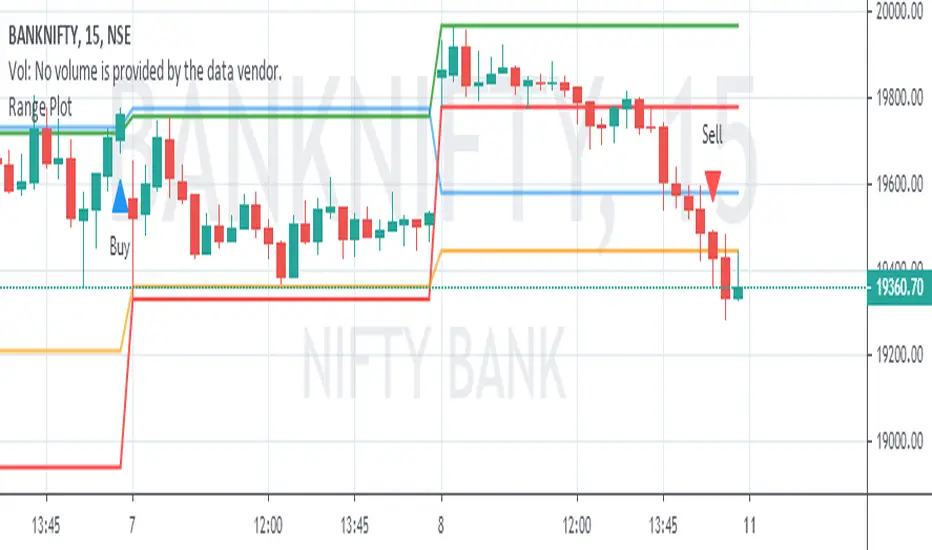
Today's first 75 minutes candle high in darker blue color and today's first 75 minutes candle low in darker red color.
Previous trading session last 75 minutes candle high in green color and previous trading session last 75 minutes candle low in orange color.
Today's marking are in blue n red little darker and previous day's last candle marking are in orange and red.
You are likely to familiar with the opening range of 5 min, 15 min, or even of 60 min also. In the opening range, we use today's' candle only. In the range plot, we have made a little addition of previous trading session last candle also. And we got very good results.
Price doesn't know what we have plotted. we just try to make our trading decisions around this area.
Range plot give very good signal in trending scripts and it helps to keep us out from ranging stock.
סקריפט מוגן
סקריפט זה פורסם כמקור סגור. עם זאת, תוכל להשתמש בו בחופשיות וללא כל מגבלות – למד עוד כאן
כתב ויתור
המידע והפרסומים אינם מיועדים להיות, ואינם מהווים, ייעוץ או המלצה פיננסית, השקעתית, מסחרית או מכל סוג אחר המסופקת או מאושרת על ידי TradingView. קרא עוד ב־תנאי השימוש.
סקריפט מוגן
סקריפט זה פורסם כמקור סגור. עם זאת, תוכל להשתמש בו בחופשיות וללא כל מגבלות – למד עוד כאן
כתב ויתור
המידע והפרסומים אינם מיועדים להיות, ואינם מהווים, ייעוץ או המלצה פיננסית, השקעתית, מסחרית או מכל סוג אחר המסופקת או מאושרת על ידי TradingView. קרא עוד ב־תנאי השימוש.